Technical Analysis - ‘Linear Weighted Moving Average’ (LWMA)
InvestorEducation / Learn to Trade Jan 07, 2013 - 08:41 AM GMTBy: Submissions
 Marcus Holland writes: The LWMA is a technical indicator which responds faster than the ‘Simple Moving Average’ (SMA) to new price developments because its latest readings are emphasized more than its older ones. However, the LWMA is not as popular as the (SMA) and the ‘Exponential Moving Average’ (EMA). The LWMA was designed to counter the lagging problems identified with the SMA in a similar way as the EMA.
Although the LWMA places more emphasize on its latest data by deploying similar techniques to the EMA, it differs in that a linear progression is used to weight its latest readings. For example, if you use a five-day LWMA, then the closing price of the first day would be multiplied by one, the 2nd day by two, and the fifth day (5th day) by five. The final values are then obtained by dividing daily readings by weight. As such, the more recent LWMA readings receive more emphasis compared to older ones.
You will find that the LWMA is best deployed as a long-term technical indicator because the importance of weighting increases with the longer time-frames. You can utilize the LWMA in the same way that you use the EMA. You will find that many traders utilize a combination of the LWMA and SMA concurrently. This is because you can receive buy and sell alerts when these two moving average crossover. In addition, you can confirm trends by identifying when the SMA and LWMA are moving in identical directions.

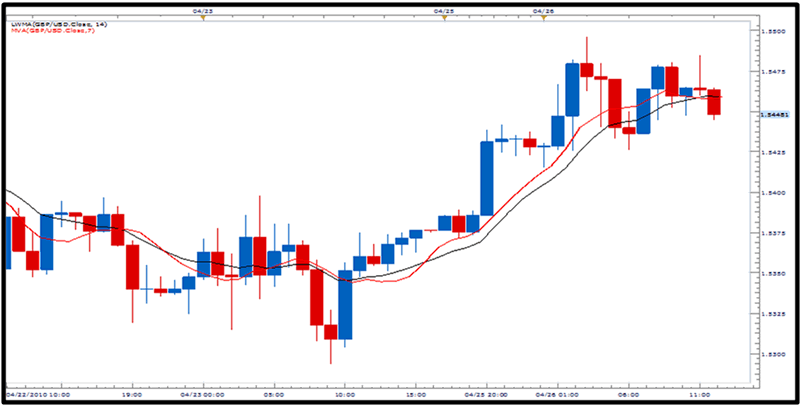
You can confirm these features on the above GBP/USD chart. You will notice towards the middle of the chart that the crossing of the LWMA (red line) above the SMA (black line) is accompanied by a bullish price movement. You need to appreciate that the LWMA is evaluated by multiplying a specified number of prior days’ readings with a weighted factor. The weight parameter is determined by using the day count that you choose for your moving average.
To select the moving average best suited for your requirements, you need to appreciate that they perform differently depending on the weight coefficients associated with their latest data readings. For example, the readings of the SMA are calculated by regarding every timeframe of equal importance whether it is new or old. In contrast, the EMA and LWMA place much more emphasize on their latest readings.
In addition, the readings of ‘moving average’ technical indicators are calculated by using a number of factors, i.e. the highest, lowest, opening and closing prices of each time frame, etc. As you should be able to confirm from studying the above diagram, you will receive selling and buying signals when price drops beneath and climbs above the LWMA. However, you will find that the LWMA is not the ideal technical indicator to utilize in order to identify price reversals associated with the start and endings of trends.

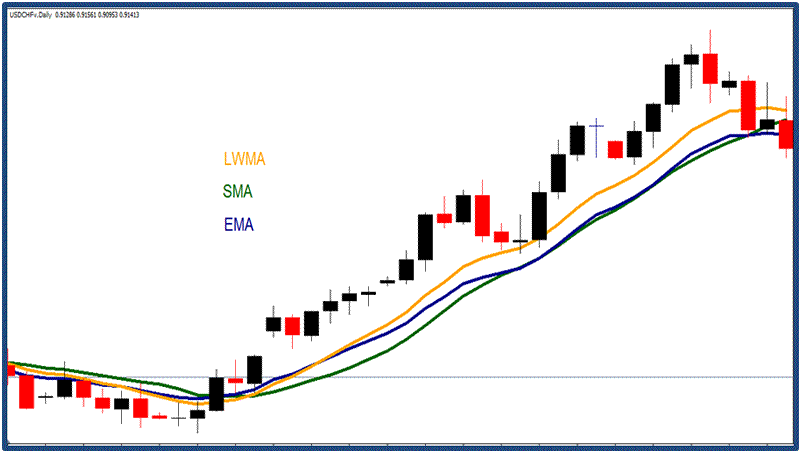
The above chart demonstrates the different moving averages in action. The SMA is colored green; the EMA is blue and the LWMA is gold. From studying the above chart, you can confirm that the LWMA responds the fastest to price changes because this indicator’s latest values are emphasized more than its older readings.
Consequently, many traders exploit this valuable feature of the LWMA to help them determine if price is trading a bullish or bearish trend. For example, on the above chart, the LWMA crosses over the SMA at the start of the bullish trend displayed in the middle of the diagram. The LWMA then remains significantly higher than the SMA as price climbs.
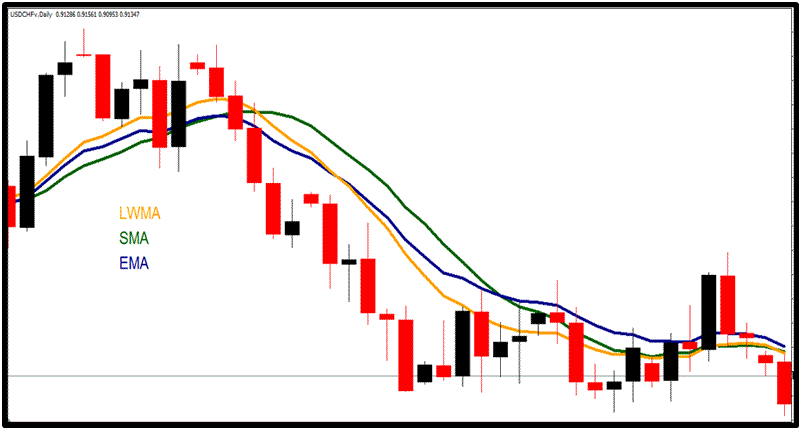
Another main feature illustrated is that price remains constantly above the LWMA during this bullish trend. The EMA also displays the same features but they are not as distinct as those of the LWMA. The next chart demonstrates that the LWMA remains well beneath the SMA during a bearish trend.

However, you should also notice that the EMA crosses below the SMA at the start of the bearish trend much faster than the LWMA. In fact, the LWMA does not achieve this status until the trend is quite well developed. This is why traders prefer the EMA to detect price reversals to the detriment of the LWMA. However, the LWMA is still the premier choice to track and monitor trends once they are fully developed.
Marcus Holland
http://www.financialtrading.com
© 2013 Copyright Marcus Holland - All Rights Reserved
Disclaimer: The above is a matter of opinion provided for general information purposes only and is not intended as investment advice. Information and analysis above are derived from sources and utilising methods believed to be reliable, but we cannot accept responsibility for any losses you may incur as a result of this analysis. Individuals should consult with their personal financial advisors
© 2005-2022 http://www.MarketOracle.co.uk - The Market Oracle is a FREE Daily Financial Markets Analysis & Forecasting online publication.


