Taking Advantage of Recent Lows in Stock Market Volatility Index
Stock-Markets / Volatility Jan 09, 2013 - 10:39 AM GMTBy: J_W_Jones
 One of the newest option products to appear in our universe as an options trader is the option series designed to trade the volatility index (VIX). The VIX is a measurement of the implied volatility of the S&P 500 index.
To review quickly, the implied volatility of an options series is reflective of the aggregate market opinion of the future volatility of a given underlying asset. In terms of the Volatility Index, the price is the current market opinion of the future volatility in the S&P 500 Index over the next 12 months.
As are all attempts to predict the future, this value does not always reflect accurately the actual volatility as it plays out prospectively, but at a practical level it is the best we can do. As sage philosophers have long noted, "the future isn't what it used to be."
The importance for traders is the well established and generally known inverse correlation between prices for the given underlying and the measure of implied volatility, in this case our VIX value. What is typically less known is the fact that levels of implied volatility correlate even more closely to the velocity of the price move of the underlying asset in question.
Because rapid price moves occur far more frequently to the downside, it follows that the general correlation between price and implied volatility is inverse. A fundamental characteristic that underscores the logic of this trade is the strong tendency of the VIX to revert to its recent mean. While this is not a certainty, it is unquestionably a high probability outcome.
For professional traders, much of the focus of hedging activity has recently moved to establishing protective positions in this index rather than such older techniques as buying out-of-the-money protective index puts. However there are some well recognized pitfalls in this approach that lay in wait for the retail trader not aware of some of the nuances inherent to this approach.
One of the major risks in trading this product derives from the fact that the options are based on the value of VIX futures. Because there is no mandatory mathematical linking of the value of these futures in the several available expiration months as is routinely present in the options series with which most traders are familiar, a huge and not generally recognized risk exists.
The founders of one of the major retail options brokers have repeatedly cautioned that the single major cause of irreparable account 'blow ups" they witnessed were the result of time spreads, aka calendar spreads, in this VIX product. This is the result of the ability of the various expiration months to move without mutual correlation in response to significant market events.
The result of this observation is the practical consideration that time spreads in the VIX must never be traded. No calendar spreads must ever be considered when trading the VIX. Failure to follow this admonition will subject your account to risk far beyond what you consider to be remotely possible. Simply put, "Don't do it."
So what trades in the VIX carry reasonable and definable risk? A wide variety of trades including those with both defined and undefined risk is feasible. Such trades include verticals, butterflies, condors, and simple long and short options.
Long time readers know that I strongly prefer to structure positions to include at least a component of positive theta within my trades. Positive theta simply means that the spread has a component that will benefit from the passage of time. Let us consider a modified butterfly position; this position is commonly termed a broken wing butterfly.
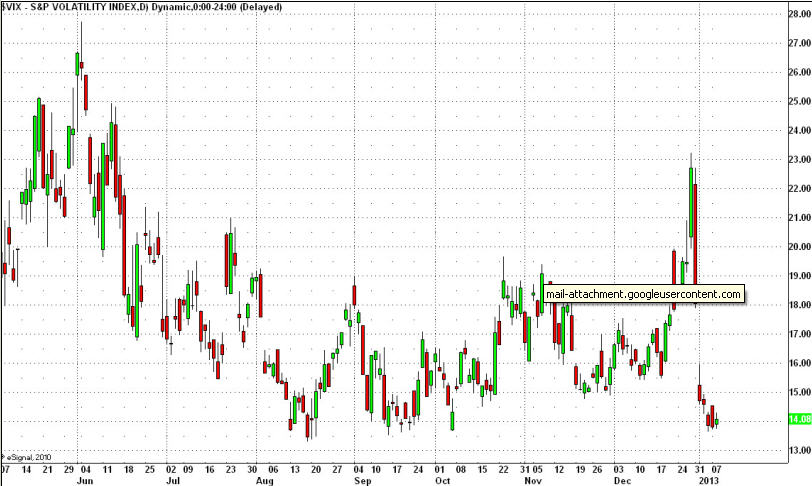
First, let us review the current chart pattern of the VIX:

As can clearly be seen in the chart above, the VIX is at multi-month lows, and perusal of even longer term charts confirm this value is at multi-year lows. Given this situation, the probability of a move upwards toward its recent mean is overwhelmingly high.
In order to give sufficient duration to our trade, I would like to look at a butterfly structure approximately 3 months into the future in order to allow for mean reversion of the VIX.
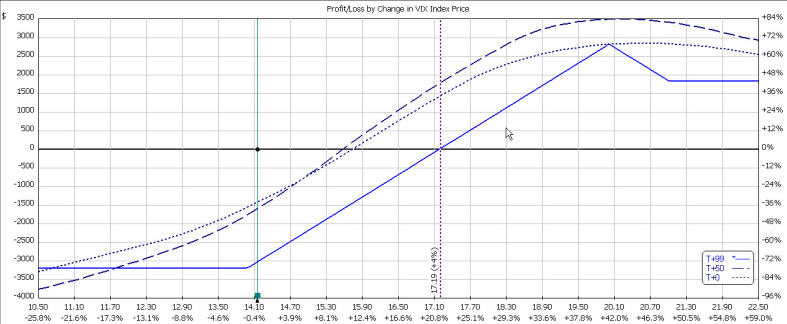
The P&L chart for our broken wing April put butterfly is displayed below:

As can be clearly seen, the trade structure has no upper bound of profitability and the risk to the lower side is the total amount paid to establish the butterfly. As such, this is a defined risk trade that will profit from a reversion of the VIX to its mean.
We welcome you to try our service to see more high probability trades that capitalize on current market conditions. Over the past two years, the service's performance track record has steadily beaten the S&P 500 Index while taking significantly less risk.
Happy Option Trading!
 If you are looking for a simple one trade per week trading style then be sure to join www.OptionsTradingSignals.com today with our 14 Day Trial.
J.W. Jones is an independent options trader using multiple forms of analysis to guide his option trading strategies. Jones has an extensive background in portfolio analysis and analytics as well as risk analysis. J.W. strives to reach traders that are missing opportunities trading options and commits to writing content which is not only educational, but entertaining as well. Regular readers will develop the knowledge and skills to trade options competently over time. Jones focuses on writing spreads in situations where risk is clearly defined and high potential returns can be realized.
This article is intended solely for information purposes. The opinions are those of the author only. Please conduct further research and consult your financial advisor before making any investment/trading decision. No responsibility can be accepted for losses that may result as a consequence of trading on the basis of this analysis.
© 2005-2022 http://www.MarketOracle.co.uk - The Market Oracle is a FREE Daily Financial Markets Analysis & Forecasting online publication.


