


US Economy - The Erosion of Growth, Tax Consequences From Gain to Drain
Economics / US Economy Jan 19, 2013 - 05:35 PM GMTBy: John_Mauldin

 In their fourth-quarter 2012 Quarterly Review and Outlook – today’s OTB – Lacy Hunt and Van Hoisington spell out the consequences of the so-called American Taxpayer Relief Act, as well as the even more egregiously named Affordable Care Act. They quickly conclude that the real effects of the tax increases on both individual taxpayers and the overall economy will be much greater than media reports have suggested.
One of the more interesting impacts is that many corporations, large and small, borrowed multiple billions of dollars to make early or special dividend payments, or paid 2012 bonuses before the year turned over. This, the authors write, “… will cause the fourth quarter national income and product figures to be dramatically overstated and will provide no guide to the prospects for 2013. However … income should show a sharp decline early in 2013.”
They go on to explain the damaging effects of the tax multiplier and the implications for government revenue and debt. The upshot is that our federal deficit will continue to exceed $1 trillion per year and our debt-to-GDP ratio will continue its dangerous climb above the 100% mark – we can expect it to be 107% by the end of the year.
Lacy and Van are deeply concerned, as am I, about the deeply corrosive effect of federal fiscal shenanigans (and Congressional foot-dragging) on economic growth; and they lay out a number of fundamental conclusions, drawn from the work of eminent economists ranging from David Ricardo in the early 19th century right up to Rogoff and Reinhart in the present day, that “strongly suggest that the latest fiscal policy actions will serve to further restrain economic growth. We cannot tax ourselves into prosperity ... We can, however, deficit spend ourselves into poverty.”
We’re going to have to do better, a lot better, if we’re going to restore true prosperity to our economy, and we don’t have a lot of time. This year is crucial.
I am grateful, as always, to Lacy and Van for sharing their work with us. Hoisington Investment Management Company (www.hoisingtonmgt.com) is a registered investment advisor specializing in fixed-income portfolios for large institutional clients. Located in Austin, Texas, the firm has over $4 billion under management, composed of corporate and public funds, foundations, endowments, Taft-Hartley funds, and insurance companies.
I write this note from Athens, having come back from dinner at a fabulous local restaurant (Abyssinia Café – you must get the chicken), courtesy of our local hosts, Antoine Yazbek and Andre Chelhot. The restaurant has a magnificent view of the Acropolis, which is different from the view of that ancient Greek wonder you see from the rooftop bar of the Grand Bretagne. Interestingly, I had drinks (a nice non-alcoholic beer, thank you) with yet another reader, Jeremy Downward, who moved here from Britain a few decades ago, and the deal that launched his investment bank was the buying and selling of the hotel. When he first bought it, the bar was just a room with a view but was not built out. Today it has one of the greatest views from a downtown hotel in the world. And in the summer, when you can sit outside? I have to come back.
And tomorrow Christian Menegatti (of Roubini Economics) and I will tour the Acropolis and new museum with yet another reader, George Drimiotis, who has been kind enough to arrange a number of meetings as well. It has been 25 years since I have walked those ancient steps, and I am looking forward to it. They say the new museum is fabulous.
I will be writing about what I learned this week, not just here in Athens but all over Europe, as I travel to Geneva on Sunday. But the bulk of the letter will be on Greece. This has been a most thought-provoking trip. We have talked to literally dozens of people (business leaders, central bankers, politicians, investment types), including by means of a few ad hoc meetings in the local tavernas in the evenings. The views there were different from those of the central bankers, but there is a rhyme that I will try to tease out for you.
Until Sunday night, have a great weekend. Î ΠΑ! (Opa!)
Your overwhelmed with information analyst,
John Mauldin, Editor
Outside the Box
JohnMauldin@2000wave.com
Hoisington Investment Management – Quarterly Review and Outlook, Fourth Quarter 2012
Tax Consequences: From Gain to Drain
The American Taxpayer Relief Act has lifted the immediate uncertainty of the fiscal cliff. Nevertheless, tax increases that are already in effect from this act, as well as the Affordable Care Act, impose a major obstacle to growth for the U.S. economy in the first half of 2013. The result of these taxes is considerable, especially in light of the poor trend in household income. In addition, these tax increases will continue to act as a drag on economic growth until late in 2015 and are unlikely to produce the revenue gains advertised.
Based on static scoring, the initial direct impact of the federal tax changes totaled approximately $250 billion for 2013. The return of the FICA tax rate to 6.2% is the largest component ($127 billion), but several other federal tax changes also became effective. These include:
1. A 4.6% increase in the top marginal tax rate to 39.6%;
2. A phase-out of itemized deductions (mortgage interest expense, various state taxes - income, property and sales - and charitable gifts) for high-earners;
3. A phase-out and elimination of personal exemptions for high-earners;
4. An increase in the tax rate to 20% for capital gains and dividends for high- earners;
5. A 3.8% surtax on capital gains, dividends and other investment-type incomes for high-earners;
6. A 0.9% surtax added to the Medicare tax for high-earners;
7. A 2.3% excise tax on medical device manufacturers;
These taxes amount to a reduction in real household income, less transfer payments, of 2.6% ($250 billion divided by $9600 billion). While the corporate sector will collect the taxes on item 7, the ultimate impact of this tax will fall on the household, as such taxes invariably do. In addition to federal tax changes, California Prop 30 hiked marginal income tax rates retroactive to 1/1/12, adding another $12 billion tax increase for 2012- 13, with the impact falling almost all in 2013. In total, the new federal and state taxes amount to 2.7% of real household income. Households will not be able to easily absorb such an income reduction.
Fleeting Boost for the Fourth Quarter
The pending tax hike is, in all likelihood, the only reason real non-transfer income jumped in November following a four month decline. An unknown but significant amount of income was pulled from 2013 into 2012, as has been the case in all of the previous well-advertised tax increases. December income, which is not yet reported, should get a further boost from this effect. Numerous corporations borrowed multibillions of dollars to make early or special dividend payments. In addition, many large corporations, banks and securities firms paid 2012 bonuses in 2012 rather than early in 2013. This practice was undoubtedly repeated many times by smaller and privately held firms.
Indeed, this long observed effect of accelerating income in anticipation of tax increases will cause the fourth quarter national income and product figures to be dramatically overstated and will provide no guide to the prospects for 2013. However, as a result of the income transfer, or substitution effect, income should show a sharp decline early in 2013. The pending tax hikes provided a major plus for the fourth quarter, a support that will be more than reversed this year.
The Highest Marginal Tax Rates in 27 Years
Item 2, which is known as the Pease Amendment, is estimated to raise the marginal tax rate on the high-earners by up to 2%. Combining these hikes, the top marginal tax rate has just jumped to 46.3%, the highest effective tax rate since The Tax Reform Act of 1986 was enacted. Thus, the 2013 top marginal tax rate is nearly one third higher than last year. The current tax hike is on par with the one in 1937, which imposed the first FICA tax, boosted the marginal tax rate from 56% to 62% and imposed an excess corporate profits tax. The economy, which had made some recovery from 1934-36, fell back sharply in 1937 and 1938. While other factors, such as retaliatory currency devaluations and monetary policy mistakes, were also occurring, the 1937 tax increase served to prolong the Great Depression. The marginal tax rates are now above 50% in the high tax states such as California, Illinois, New York and New Jersey. Such high and permanent marginal tax rates render the static scoring method of calculating the restrictive effects of such tax increases completely inadequate.
Dynamic Scoring
The alternative and superior method for gauging the impact of tax changes is known as dynamic scoring, a procedure that takes into account the first, second and further subsequent round impacts of higher taxes, or what is referred to as the “tax multiplier.” The multiplier on permanent tax rate increases is strongly negative. At a minimum the multiplier is -2 for the upcoming three-year period. Alan Viard, a Harvard educated economist, has documented that the disincentive effects of changes in tax rates depend on the marginal tax rate. To quote Dr. Viard, “ Moreover, the distortion rises disproportionately with the marginal tax rate, roughly quadrupling when the marginal tax rate doubles” (The High-Income Rate Reductions, AEI Tax Policy Outlook, No. 3, September 2010). Christina and Paul Romer found the tax multiplier to be -3 over three years (The Macroeconomic Effects of Tax Changes: Estimates Based on a New Measure of Fiscal Sh ocks, University of California, Berkeley, March 2007). The current tax rate increases, heavily concentrated on the high marginal tax rates, are likely to produce a persistent drag on economic activity.
A variety of factors explain the highly negative tax multiplier. Potential after-tax rates of return on risk-taking ventures are highly sensitive to tax changes. When taxes are raised, some activities will be transferred to lower tax countries and avoided in ways that tax code writers are unable to imagine. When they are lowered, more activities are brought home. Approximately 500,000 privately held firms employing 15 or more people will be directly impacted by changes on high marginal tax brackets. Some of the 2013 tax increases will be deflected to their suppliers, employees or customers.
Implications for Government Revenue and Debt
These multiplier effects mean that the gain in tax revenues will not be as large as indicated by the static measurement effects. Additionally, due to ongoing increases in federal outlays, the budget deficits will continue to exceed $1 trillion per year. Federal debt relative to GDP will continue its upward trajectory.
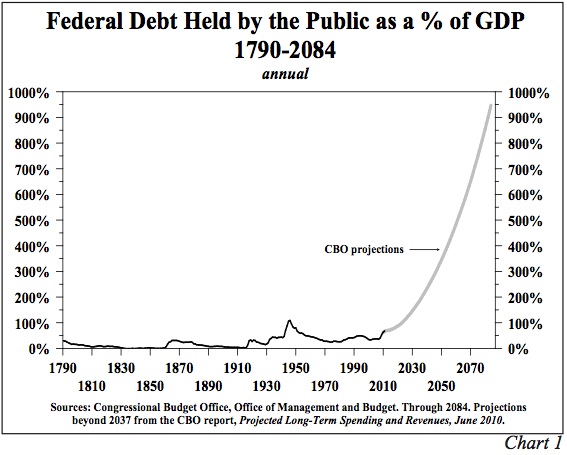
The federal debt to GDP ratio jumped to 103.5% at the end of 2012, the highest since 1947. In spite of the new taxes, this ratio will likely climb to 107% by the end of this year. Moreover, in 2010 the nonpartisan Congressional Budget Office (CBO) forecasted gross federal debt held by the public could reach 344% of GDP in 2050 and 947% in 2084, with entitlements playing an important role (Chart 1). This new tax legislation does not alter the looming explosion in entitlement spending, and it will not lift the U.S. economy out of its faltering growth pattern. Thus, the new legislation ignored the conclusion of the Simpson Bowles Commission that emphasized the need for tax and entitlement reform as well as expenditure restraint.
The Entitlement Problem
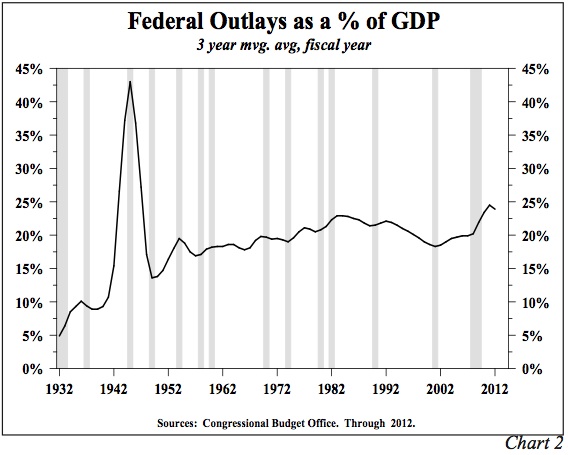
In the past three fiscal years, federal outlays averaged about 24% of GDP, the highest levels since World War II (Chart 2). As recently as 1998 to 2000, outlays averaged 18.7% of GDP. Federal outlays will grow sharply since 10,000 people will reach full eligibility for Social Security and Medicare each day in the next seventeen years.
Barry Eichengreen, a Yale Ph.D. in economics and University of California Professor, estimated that without law changes in Social Security and Medicare, federal outlays will reach a staggering 40% of GDP in twenty-five years (Exorbitant Privilege, Oxford University Press, 2010). Of course this assumes that the U.S. government will be able to borrow the funds to meet these obligations.
The Erosion of Economic Growth
The one complete decade of the 21st century (2000 through 2009) ranks as the 21st slowest growth in real GDP of the entire 22 decades since 1790 (Chart 3).
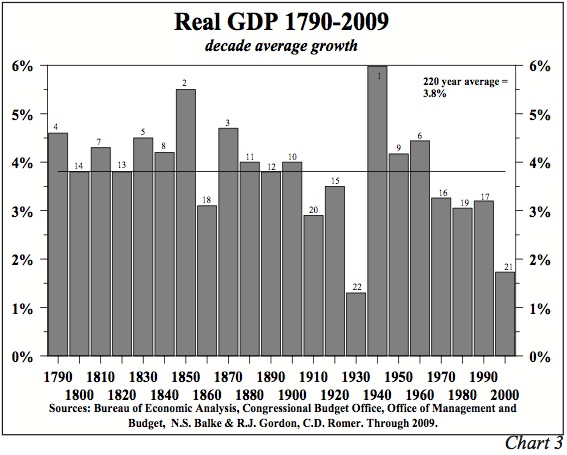
Only the experience in the 1930s was worse. The 1960s was the last decade when the economic growth rate was above the post 1790 average, indicating that the deterioration in economic conditions is not a new phenomenon. In the thirteen years of this century, the GDP growth rate has averaged just 1.8%, or less than half of the 3.8% average since 1790, suggesting that the erosion of the economy is continuing.
Other measures point to a loss of well-being. Real median household income is at the lowest level since 1995. Since 2010, the Misery Index, the sum of inflation and unemployment, has been well above its long term average. The loss of economic vitality has begun to adversely affect demographics. In 2011, the birth rate was the lowest since records began in 1920, while the percentage increase in the population, including legal and illegal immigration, was the slimmest since 1940. The percentage of those aged 25 to 34 living at their parents’ homes hit a record high. Those receiving food stamps recently surged to one out of every 6.5 Americans, while the percent of U.S. households paying federal income taxes has fallen to an all-time low. The employment to population ratio, the most accurate measure of labor market performance, currently stands very close to its lowest level in three decades. These circumstances, in part, may be traced to fiscal policy errors.
Fiscal Economics and the Growth Problem
Relying on logic and empirical testing, scholarly research on fiscal economics may be condensed into seven propositions. Logic for these conclusions reaches as far back as David Hume, leader of the Enlightenment in 1752 and David Ricardo, originator of the law of comparative advantage and diminishing marginal returns in 1821. They were followed by contemporary scholars such as Stanford Economist John Taylor, author of the famous monetary rule, Chicago Economist John H. Cochrane and Harvard Economists Robert Barro, Carmen Reinhardt, Ken Rogoff and Niall Ferguson. The empirical work supporting these conclusions has been conducted using data since 1800, as well as for shorter time spans, and has taken place in the United States, Europe, Italy and Sweden. Various scholars from different countries are broadly reaching similar conclusions, such as:
1. Government debt relative to GDP has reached extremely high levels. Rigorous statistical examinations of different countries and time periods, including the period since 1800, indicate that such debt levels have a deleterious effect on economic growth. High government debt diminishes long-term decision- making because the high debt raises the possibility of increased taxes or future financial crises. The high debt also undermines future growth when it primarily finances current consumption rather than productive investment.
2. Due to commitments made under Social Security and Medicare, the U.S. government debt to GDP ratio will rise dramatically because the default response is to borrow the funds needed until that option is exhausted. The elevated borrowing will accelerate the rate at which economic growth deteriorates.
3. The multiplier on government expenditures is trivial, if not negative. At the end of three years, deficit spending produces no higher level of GDP, but private GDP is shifted to the government sector. In addition, government debt is a higher percentage of GDP, and interest and repayment must be shouldered by the diminished private sector.
4. The marginal tax multiplier is significantly negative. Each 1% increase in the marginal tax rates will reduce real GDP between 2% and 3% by the end of three years, provided that tax rates are permanent. Short-term tax rate changes have a considerably lower multiplier because, as the studies show, households will save the bulk of what they consider to be transitory income.
5. Temporary fiscal policies destabilize the economy by creating uncertainty and eroding the foundation for long-term decision-making. The fiscal cliff is a result of temporary policies that reached their expiration point. When households and business don’t know the rules of the game, they are forced to forego longer- term, but higher return generating, projects.
6. The tax expenditure multiplier (itemized deductions) is slightly negative.
7. As high debt levels diminish economic performance, interest rates remain low for protracted periods of time. Ultimately, however, the marketplace may lose confidence in the government’s ability to sustain the debt levels, and a country will reach Reinhardt and Rogoff’s “bang point” or Cochrane’s “condition”, causing interest rates to rise.
These seven propositions strongly suggest that the latest fiscal policy actions will serve to further restrain economic growth. We cannot tax ourselves into prosperity as FDR’s 1937 effort and numerous other historical cases demonstrate. We can, however, deficit spend ourselves into poverty. Consistent with the academic research, we could not find historical precedent for the proposition that prolonged deficit spending achieved prosperity. Numerous examples of great empires like the Mesopotamian, Roman and the Bourbons of France collapsed under the weight of high government debt. Other countries have survived but have languished under increasingly miserable economic conditions.
Still valid is the thinking of classical economists like Adam Smith and John Stuart Mill: prosperity derives from the hard work, creativity and ingenuity of a country’s people, not by the federal government spending funds that it does not have. However, by diverting dollars from highly productive individuals and businesses through borrowing or taxes, government policy can spend a country into poverty. Transferring assets from income and wealth generators to consumption, unproductive or even counterproductive uses, however, produces failure.
Treasury Bonds
The global economic environment is best characterized by an insufficiency of aggregate demand. That is, the capacity to produce goods far exceeds the final demand for those products. The root cause for this circumstance is debated, but we believe academic studies point directly to overconsumption relative to income in recent decades. Borrowing, leading to over-indebtedness, has funded this excess spending. Economic systems must now repay or rationalize the debt in some manner. Whatever the cause of the inadequacy of final demand, the result has been a deflationary environment.
To be sure, prices of many items are rising, partially due to legislative changes in taxes, fees, regulation, compliance costs, medical mandates and other non-market forces. However, competition in the marketplace has created downward pressure on market driven prices. Thus, we have an unusual paradox whereby legislative and regulatory changes elevate the cost of living, yet with this inflation, there is no associated growth in income and standards of living decline. In this circumstance, real income falters, and purchases of non-mandated and discretionary items decline in value and price. Call it “the deflationary paradox of legislated increases in the cost of living.”
The central banks of the world have created vast amounts of liquidity to spur more consumption and greater demand, with the U.S. Federal Reserve qualifying as an outstanding example. In 2008, the Fed increased its liabilities by almost 1800%. This Fed process of paying for purchased securities is a mere accounting exercise. With a stroke of a bookkeeper’s pen it “creates” funds to pay for the purchased securities. This fund creation is assumed to be inflationary as it is often mislabeled and referred to in many articles as printing money. Increased Fed liabilities and an equivalent rise in Fed assets are not really money. However, it does create the potential for increased money. These Fed actions raise inflationary expectations which result in rising financial speculation and increasing interest rates. Recently, during QE infinity, long-term interest rates have risen, replicating the experience in QE1&2.
Despite the fact that most market participants expected higher inflation after the 2008 monetary explosion, the contrary has occurred. It has now been more than five years since the near 1800% increase in the Fed’s balance sheet, yet the economy languishes, and prices remain under downward pressure. Why? The Fed does not control the amount of money circulating in the economy nor the speed at which it turns over.
The key ingredient to fostering monetary growth, and thus final demand, is an increase in the kind of borrowing which (1) aids future productivity and income and (2) increases financial innovation. Presently, after sixty months of the most massive Fed balance sheet expansion, no evidence of an inflationary spiral can be found. Nor, in our judgment, is one likely to occur. The process of unwinding debt overhangs is a long one, and unfortunately our society continues to pile on debt at near record amounts. This action is deflationary.
We have been of the opinion that the 30-year Treasury bond rate could not go up and stay up since well before the initiation of QE1. It has been an expensive wait for those expecting higher interest rates, as they have actually declined. Today, with long-term Treasury yields around 3%, our view remains the same. Interest rates may, will and have gone up based on periodic changes in psychology. However, underlying fundamentals have insured they have not been able to remain elevated. The fundamentals of insufficiency of demand and its root cause, over-indebtedness, still point to an environment in which long-term interest rates remain on a path to lower levels.
Van R. Hoisington Lacy H. Hunt, Ph.D.
John Mauldin
subscribers@MauldinEconomics.com
Outside the Box is a free weekly economic e-letter by best-selling author and renowned financial expert, John Mauldin. You can learn more and get your free subscription by visiting www.JohnMauldin.com.
Please write to johnmauldin@2000wave.com to inform us of any reproductions, including when and where copy will be reproduced. You must keep the letter intact, from introduction to disclaimers. If you would like to quote brief portions only, please reference www.JohnMauldin.com.
John Mauldin, Best-Selling author and recognized financial expert, is also editor of the free Thoughts From the Frontline that goes to over 1 million readers each week. For more information on John or his FREE weekly economic letter go to: http://www.frontlinethoughts.com/
To subscribe to John Mauldin's E-Letter please click here:http://www.frontlinethoughts.com/subscribe.asp
Copyright 2013 John Mauldin. All Rights Reserved
Note: John Mauldin is the President of Millennium Wave Advisors, LLC (MWA), which is an investment advisory firm registered with multiple states. John Mauldin is a registered representative of Millennium Wave Securities, LLC, (MWS), an FINRA registered broker-dealer. MWS is also a Commodity Pool Operator (CPO) and a Commodity Trading Advisor (CTA) registered with the CFTC, as well as an Introducing Broker (IB). Millennium Wave Investments is a dba of MWA LLC and MWS LLC. Millennium Wave Investments cooperates in the consulting on and marketing of private investment offerings with other independent firms such as Altegris Investments; Absolute Return Partners, LLP; Plexus Asset Management; Fynn Capital; and Nicola Wealth Management. Funds recommended by Mauldin may pay a portion of their fees to these independent firms, who will share 1/3 of those fees with MWS and thus with Mauldin. Any views expressed herein are provided for information purposes only and should not be construed in any way as an offer, an endorsement, or inducement to invest with any CTA, fund, or program mentioned here or elsewhere. Before seeking any advisor's services or making an investment in a fund, investors must read and examine thoroughly the respective disclosure document or offering memorandum. Since these firms and Mauldin receive fees from the funds they recommend/market, they only recommend/market products with which they have been able to negotiate fee arrangements.
Opinions expressed in these reports may change without prior notice. John Mauldin and/or the staffs at Millennium Wave Advisors, LLC and InvestorsInsight Publishing, Inc. ("InvestorsInsight") may or may not have investments in any funds cited above.
Disclaimer PAST RESULTS ARE NOT INDICATIVE OF FUTURE RESULTS. THERE IS RISK OF LOSS AS WELL AS THE OPPORTUNITY FOR GAIN WHEN INVESTING IN MANAGED FUNDS. WHEN CONSIDERING ALTERNATIVE INVESTMENTS, INCLUDING HEDGE FUNDS, YOU SHOULD CONSIDER VARIOUS RISKS INCLUDING THE FACT THAT SOME PRODUCTS: OFTEN ENGAGE IN LEVERAGING AND OTHER SPECULATIVE INVESTMENT PRACTICES THAT MAY INCREASE THE RISK OF INVESTMENT LOSS, CAN BE ILLIQUID, ARE NOT REQUIRED TO PROVIDE PERIODIC PRICING OR VALUATION INFORMATION TO INVESTORS, MAY INVOLVE COMPLEX TAX STRUCTURES AND DELAYS IN DISTRIBUTING IMPORTANT TAX INFORMATION, ARE NOT SUBJECT TO THE SAME REGULATORY REQUIREMENTS AS MUTUAL FUNDS, OFTEN CHARGE HIGH FEES, AND IN MANY CASES THE UNDERLYING INVESTMENTS ARE NOT TRANSPARENT AND ARE KNOWN ONLY TO THE INVESTMENT MANAGER.
John Mauldin Archive |
© 2005-2022 http://www.MarketOracle.co.uk - The Market Oracle is a FREE Daily Financial Markets Analysis & Forecasting online publication.