


AMEX Gold Bugs Index and Stock Market Trend Forecast 2013
Stock-Markets / Financial Markets 2013 Jan 24, 2013 - 12:54 PM GMTBy: David_Petch

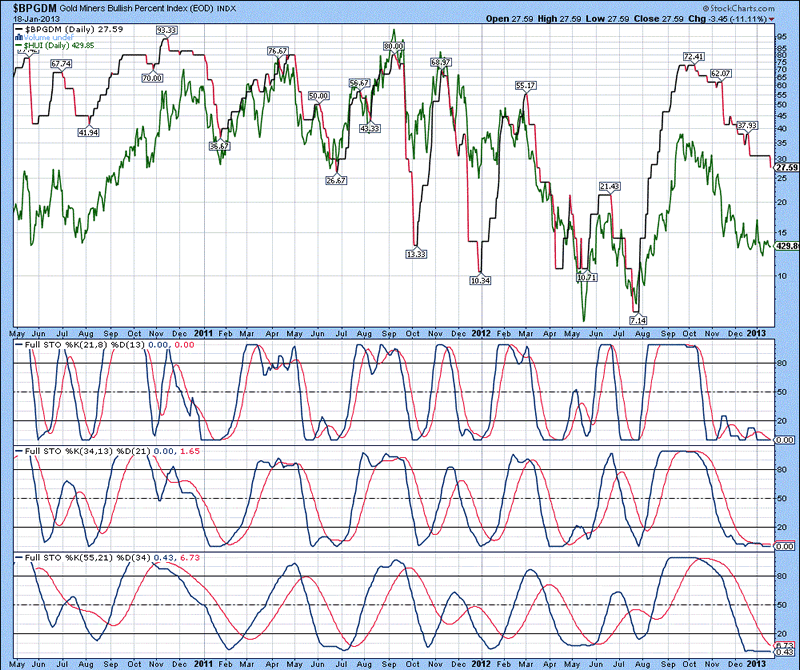
 The daily chart of the Gold Miner's Bullish Percent Index is shown below, with the HUI denoted in green. The ratio has fallen below 28, which now has put the HUI into an extremely oversold state, which suggests a breakout move is looming. Full stochastics 1, 2 and 3 are shown below in order of descent, with the %K at 0 in 1 and 2 and beneath the %D in 3. This is the most oversold condition that gold stocks have been at since 2008...most people who have sold gold stocks are out, so when some “event” acts as a spark near a pile of dry sawdust, it explodes...in our case, to the upside. Four months of downside in the HUI after a two month relief ally of seeing 12 months of downside has built a powerful case for a huge move to the upside. When this move happens, it will be very sharp, so be prepared.
Figure 1
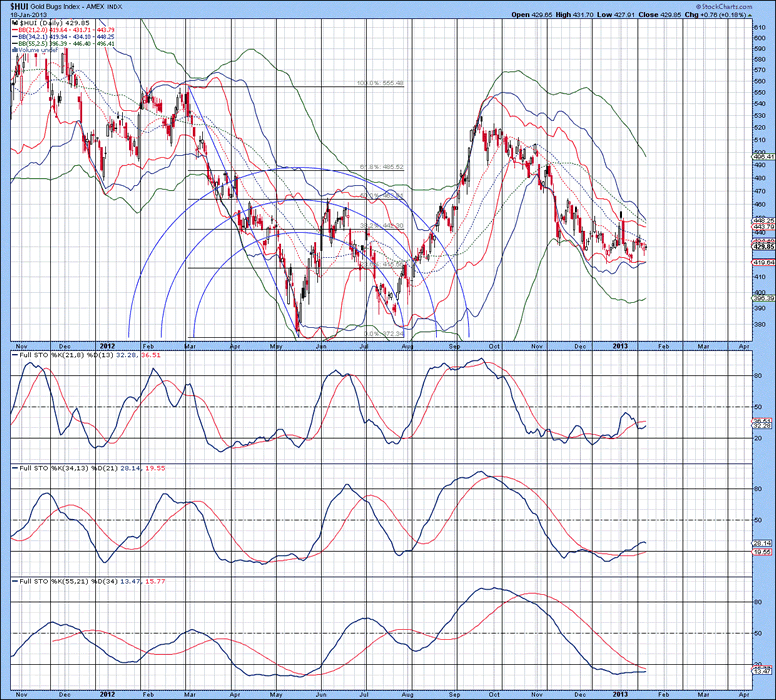
The daily chart of the HUI is shown below, with lower and upper 21 and 34 MA Bollinger bands in close proximity to each other, alongside the rounding bottom. Full stochastics 1, 2 and 3 are shown below in order of descent, with the %K beneath the %D in 1 and 2 and above the %D in 3. All of the translational energy building from the downward trend over the past 21 months is going to have to be burned off somehow and that will likely be to the upside. The bottom is in and stochastics remain in a sideways trend. GORO now has a 5% dividend rate, which to my knowledge is one of the highest rates in this sector. Continue to accumulate dividend paying stocks that have a great portfolio of properties.
Figure 2
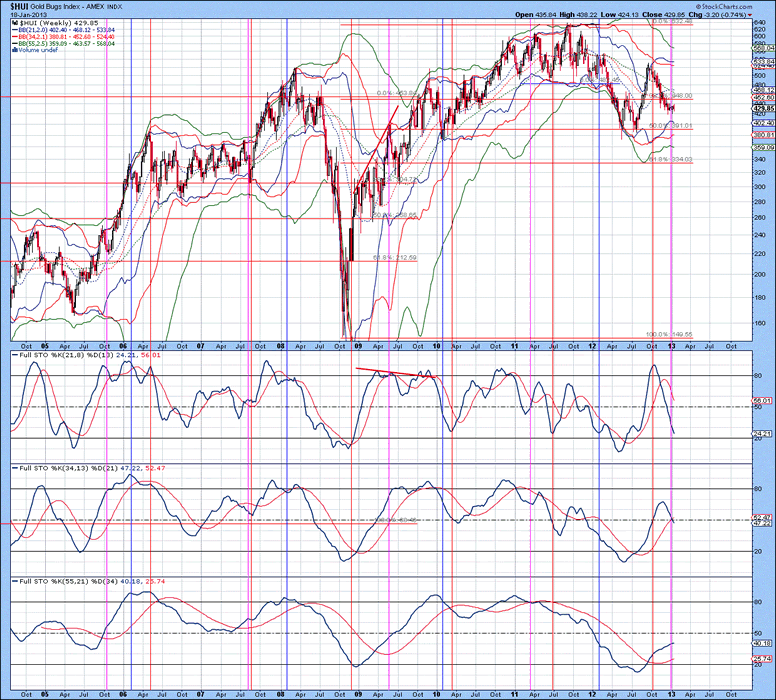
The weekly chart of the HUI is shown below, with Bollinger bands not providing any sort of indication of trend. Full stochastics 1, 2 and 3 are shown below in order of descent, with the %K beneath the %D in 1 and 2 and above the %D in 3. The weekly chat suggests further weakness, but the daily chart indicates a rounding bottom that could be complete anytime within the next 1-2 weeks.
Figure 3
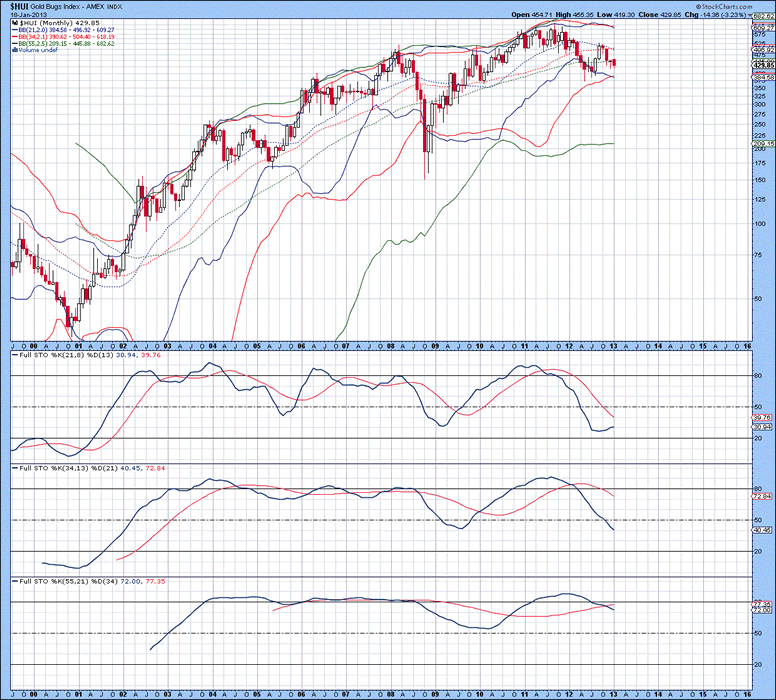
The monthly chart of the HUI is shown below, with the lower 21 MA Bollinger band beneath the 34 MA Bollinger band, suggestive that an oversold condition has developed. Full stochastics 1, 2 and 3 are shown below in order of descent, with the %K beneath the %D in all three instances. Extrapolation of the %K trend in stochastics 1 and 2 indicate that on a short-term basis, conditions are more oversold at present than 2008. A huge inverse head and shoulders forming since 2006 appears to have formed, indicates an upward price objective of 800 in the immediate future is due...this is a game of patience at present so continue to slowly accumulate producers that pay dividends.
Figure 4
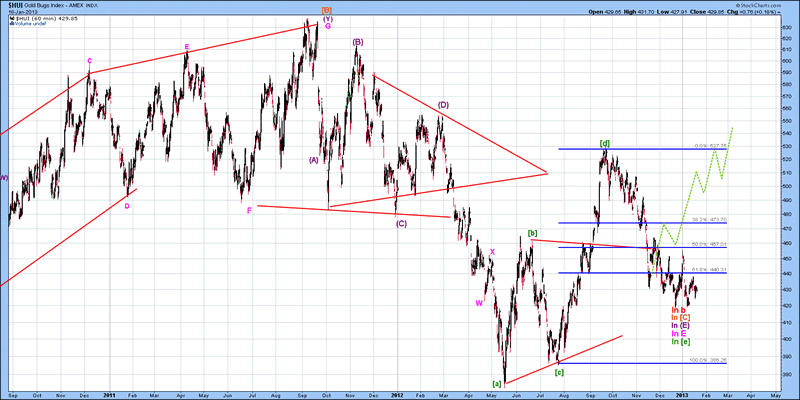
The short-term Elliott Wave count of the HUI is shown below, with the thought pattern forming denoted in green. This obviously parted direction with what has actually happened, but now, a series of higher lows appears to have created a rounding bottom. It still is expected that a move to 800-850 occurs this year, but as things appear now, this level is not expected to be seen until August or September this year, as it will likely involve two very sharp moves up with a sideways consolidation separating the phases. The first move up is expected to reach 600-630, followed by a move down to 560-580 and then a final move up to 800-850 before topping out. When we do have deflation, it will cause a move to the downside on everything other than cash...it appears that broad stock market indices are likely to trend sideways after April/May 2013 until Septemberish before a fall crash occurs, which will lead to greater financial turmoil in 2014.
Figure 5
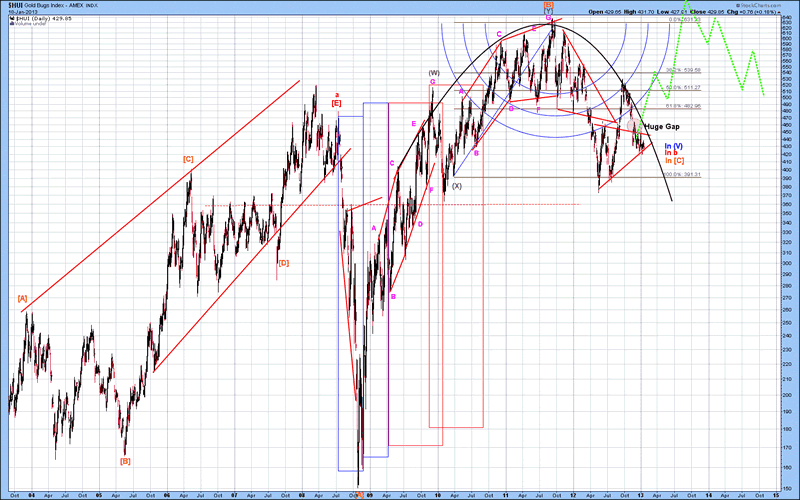
The long-term Elliott Wave count of the HUI is shown below, with wave [C] down thought to be forming at present. Wave [D] up is expected to carry the HUI to 800-850, before declining in wave [E] to around 600 at some point in 2014. Notice the huge parabola that encases the HUI from 2009 until present. This is a very powerful upper cap that when violated to the upside will see this parabola resemble a missile head to the upside. The apex of the sideways price action since May 2012 is quickly approaching, while the amount of time since the noted gap formed is increasing. The longer prices remain beneath the gap, the sharper the upward price explosion in gold will be. It is important to note that the entire move from 2008 until present is part of the same corrective structure. The Internet phase of gold stocks is years away, but having an opportunity to purchase at extremely low levels as now will likely never be seen in our lifetimes.
Figure 6
S&P 500 Index
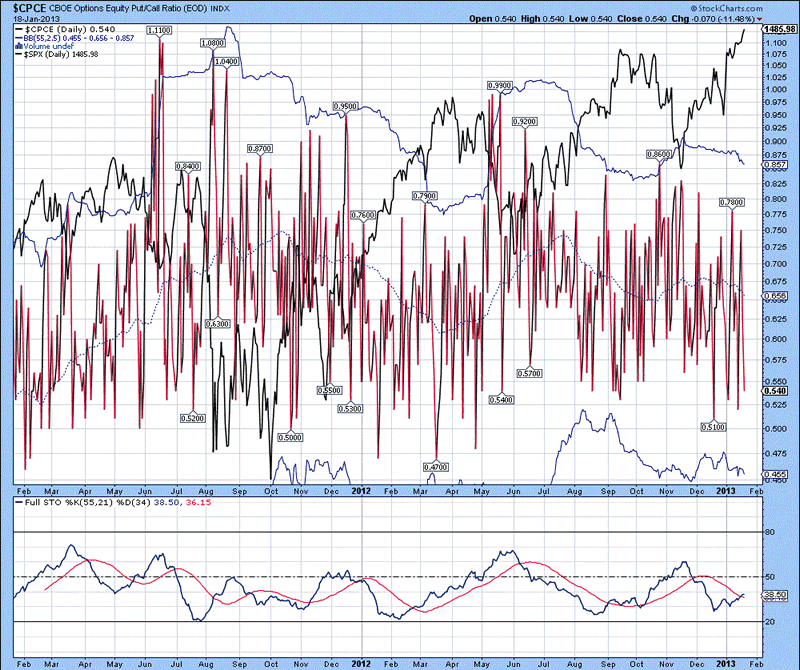
The daily chart of the CBOE Options Equity Put/Call Ratio Index is shown below, with the S&P 500 Index denoted in black. The ratio has formed a downward channel, which suggests short-term pressure on the S&P is likely. For this chart and this chart only, the %K above the %D is a sign of weakness, while beneath the %D is a sign of strength. At present, the %K is above the %D, suggestive that shot-term weakness in the broad stock market is looming.
Figure 7
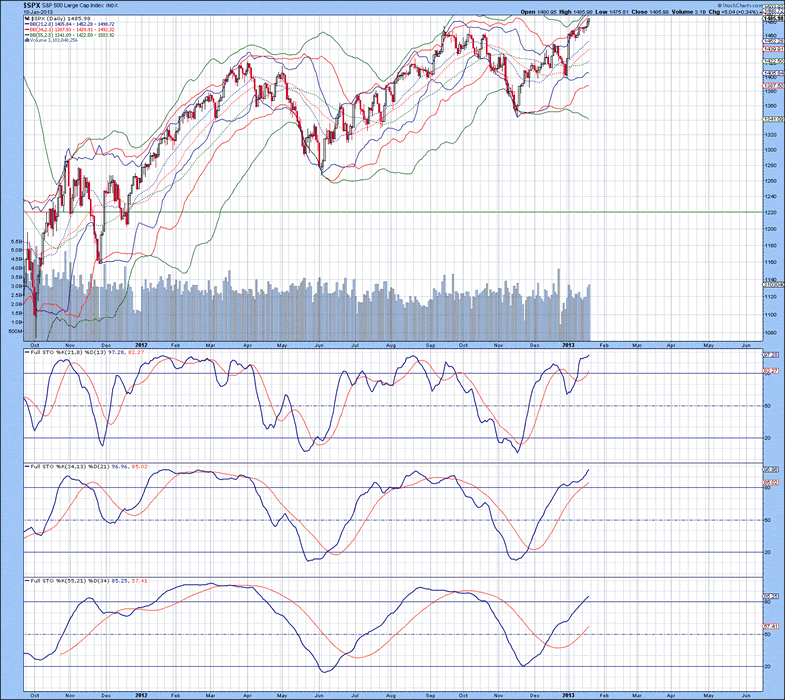
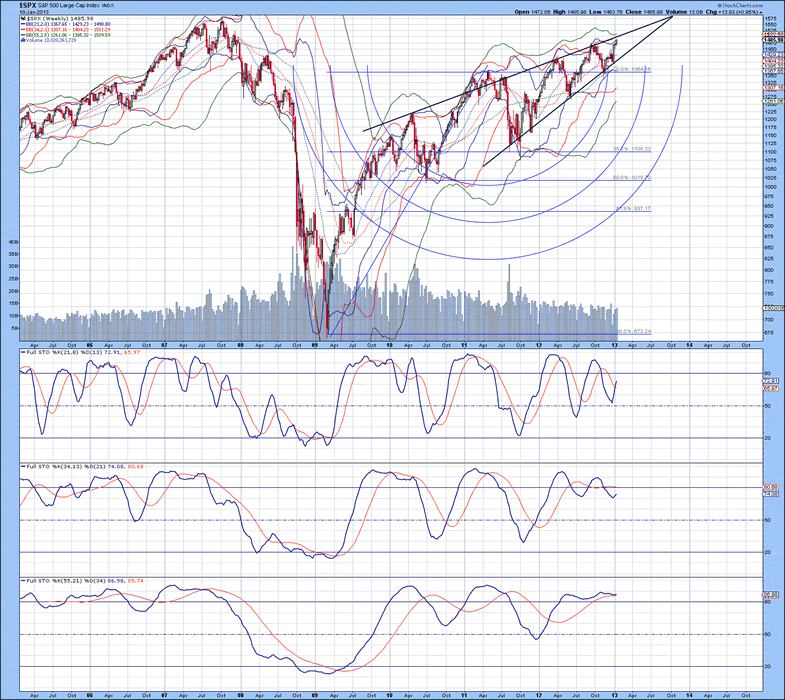
The daily chart of the S&P 500 Index is shown below, with the lower 55 MA Bollinger band still declining, suggestive that a top has not yet been put in place. Full stochastics 1, 2 and 3 are shown below in order of descent, with the %K above the %D in all three instances. Although the %K in stochastics 1 and 2 are reaching overbought levels, positioning of the %K in stochastic 3 suggests at least another 2-3 months before a long-term top is put in place.
Figure 8
The weekly chart of the S&P 500 Index is shown below, with a very large pennant type of structure having an apex near October. Upper Bollinger bands are in close proximity to the current price, suggestive that further upside is looming. Full stochastics 1, 2 and 3 are shown below in order of descent, with the %K above the %D in 1 and 3 and beneath the %D in 2. With the %K in stochastics 1 and 2 hooking up, it suggests that a top is not likely to be put in place for at least 2-3 months out. It is important to note that the S&P is approaching the upper trend line and if it is taken out, a move up to 1600-1650 (our long-term target) could occur in a very short period of time.
Figure 9
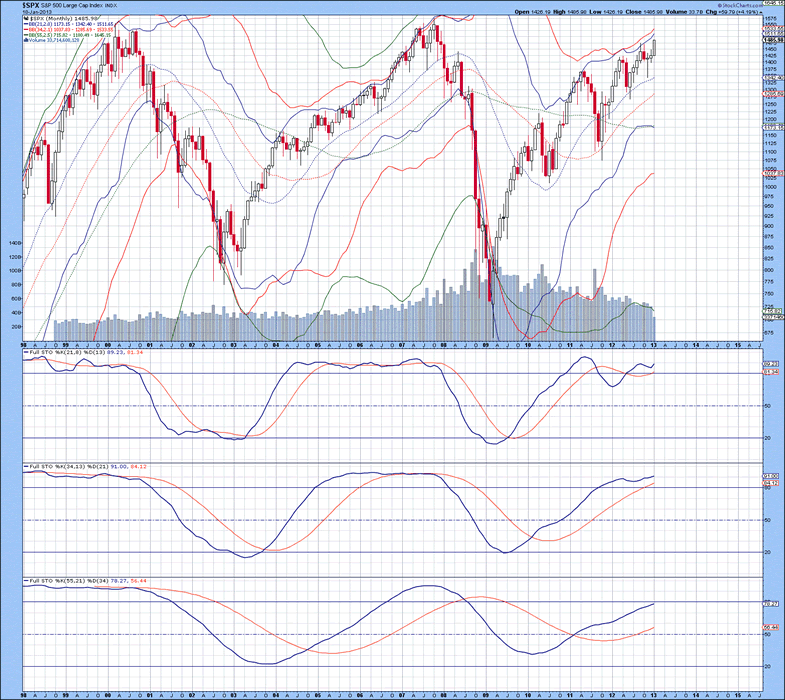
The monthly chart of the S&P 500 Index is shown below, with upper 21 and 34 MA Bollinger bands in close proximity to the current price, suggestive that further upside is looming. Full stochastics 1, 2 and 3 are shown below in order of descent, with the %K above the %D in all three instances. Extrapolation of the %K in stochastic 1 curling up suggests a top is not likely to be put in place for at least 2-4 months out. This chart clearly indicates the upward strength seen in the broad stock market indices at present, which will soon likely translate into oil breaking above $100/barrel in the not too distant future.
Figure 10
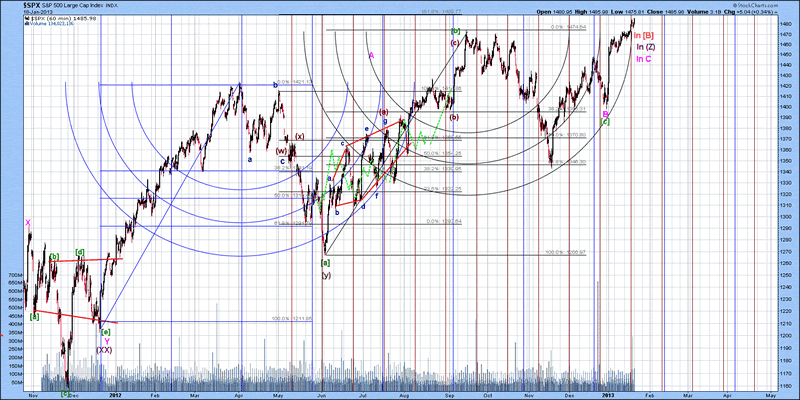
The short-term Elliott Wave count of the S&P 500 Index is shown below, with wave C.(Z).[B] thought to be forming. Wave A was 3 months, while wave B was 9 months. So, if time symmetry in this pattern is to hold, then wave C should be at least 5-6 months in length...or late May/early June 2013.
Figure 11
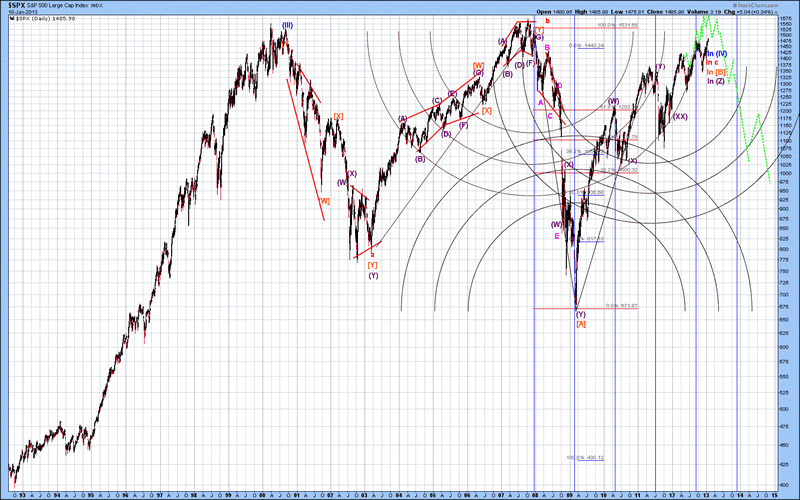
The long-term Elliott Wave count of the S&P 500 Index is shown below, with the thought pattern forming denoted in green. Once a top is put in place (expecting 1600-1650), this will complete wave [B], which will either see wave [C] down as an impulse form a flat structure for wave c or merely be wave [C] of a triangle not expected to complete until sometime in 2020. If the S&P reaches 1600-1650, the downward price objective for mid to late 2014 is between 800-850. This will be a very sharp decline in prices, so it will be worth consideration to switch out of stocks when we near the top. Those who bail into cash at the right point in time will literally be doubling their money once a bottom is put in place in 2014. A very sharp run up in prices is due into 2016, which will then be a future exit point to again play the downward trend. As we get closer and closer to the singularity point of the Contracting Fibonacci Spiral, volatility will increase as the span of time between each top and bottom diminishes.
Figure 12
That is all for today...back tomorrow with an update of 3 currencies and the US Dollar Index. Have a great day.
By David Petch
http://www.treasurechests.info
I generally try to write at least one editorial per week, although typically not as long as this one. At www.treasurechests.info , once per week (with updates if required), I track the Amex Gold BUGS Index, AMEX Oil Index, US Dollar Index, 10 Year US Treasury Index and the S&P 500 Index using various forms of technical analysis, including Elliott Wave. Captain Hook the site proprietor writes 2-3 articles per week on the “big picture” by tying in recent market action with numerous index ratios, money supply, COT positions etc. We also cover some 60 plus stocks in the precious metals, energy and base metals categories (with a focus on stocks around our provinces).
With the above being just one example of how we go about identifying value for investors, if this is the kind of analysis you are looking for we invite you to visit our site and discover more about how our service can further aid in achieving your financial goals. In this regard, whether it's top down macro-analysis designed to assist in opinion shaping and investment policy, or analysis on specific opportunities in the precious metals and energy sectors believed to possess exceptional value, like mindedly at Treasure Chests we in turn strive to provide the best value possible. So again, pay us a visit and discover why a small investment on your part could pay you handsome rewards in the not too distant future.
And of course if you have any questions, comments, or criticisms regarding the above, please feel free to drop us a line . We very much enjoy hearing from you on these items.
Disclaimer: The above is a matter of opinion and is not intended as investment advice. Information and analysis above are derived from sources and utilizing methods believed reliable, but we cannot accept responsibility for any trading losses you may incur as a result of this analysis. Comments within the text should not be construed as specific recommendations to buy or sell securities. Individuals should consult with their broker and personal financial advisors before engaging in any trading activities as we are not registered brokers or advisors. Certain statements included herein may constitute "forward-looking statements" with the meaning of certain securities legislative measures. Such forward-looking statements involve known and unknown risks, uncertainties and other factors that may cause the actual results, performance or achievements of the above mentioned companies, and / or industry results, to be materially different from any future results, performance or achievements expressed or implied by such forward-looking statements. Do your own due diligence.
Copyright © 2013 treasurechests.info Inc. All rights reserved.
Unless otherwise indicated, all materials on these pages are copyrighted by treasurechests.info Inc. No part of these pages, either text or image may be used for any purpose other than personal use. Therefore, reproduction, modification, storage in a retrieval system or retransmission, in any form or by any means, electronic, mechanical or otherwise, for reasons other than personal use, is strictly prohibited without prior written permission.
David Petch Archive |
© 2005-2022 http://www.MarketOracle.co.uk - The Market Oracle is a FREE Daily Financial Markets Analysis & Forecasting online publication.