


Stock Market Still Waiting
Stock-Markets / Stock Markets 2013 Jan 27, 2013 - 06:31 PM GMT

 From last week's report, the markets have not done much, other that chop and around, although they did move a little bit higher. My main wave count is still applicable at this time; I don't see anything at this time to concern me, although should the markets go on a tear to the upside I will obviously have to consider my options, but as it stands I still like the idea of a potential reversal setting up.
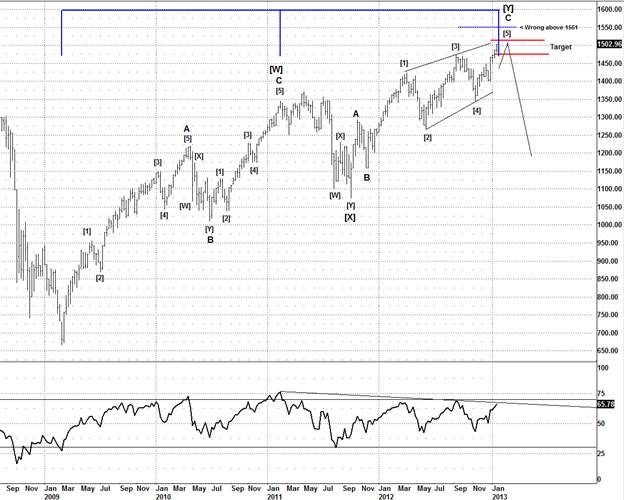
Is it time to put on the bear suits? Currently the answer is still a no, although the potential is there, the trend is still up and must be respected until we see a breakdown.
I originally targeted the 1480-1500SPX as an area of interest, and we briefly hit the top end of that range, although the idea is not actually invalid until its above 1551SPX, although personally I wouldn't want to see this above 1530SPX, so we still have some room to spare should the market want to squeeze a bit higher first.
DOW
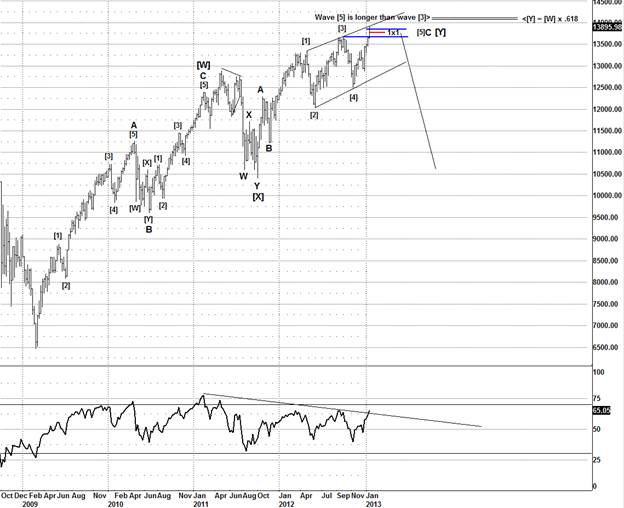
Last week I mentioned that IBM could give a lift to the DOW and get the DOW inside its target band, as it was one of the laggards on this advance, well not only did it boost the DOW, it has pushed up a bit higher than the target band, so it's gone from laggard to out right leader in a week, so like the SPX, it's still fine for the idea we have been working, although if we don't see an aggressive reversal soon then theses ideas are going to run into problems, but the same applies as the SPX, it's not on a sell, but we are watching for any key breakdown of support.
Like always we have a clear risk control point, should the market exceed that area, then we simply accept the idea is invalid and move along to other ideas.
Last week I made an error with the timing of a possible cycle date, I forgot to allow for trading days only, so we still have an outstanding potential fibbo timing date, which is still valid and something we are watching, but first and foremost, price is what we are interested in.
As I pointed out last week, there is a very aggressive bullish wave count that is technically possible, and if that is to ready to confirm itself, then it needs to see a strong breakout higher and confirm its intentions on a move higher above 1600 then onwards to 2000SPX. Whilst it's something that I consider to be a very low odds setup, the fact remains the bears need to see some sort of strong downside break, this continual grinding week after week, is not what the bears want to see.
NDX
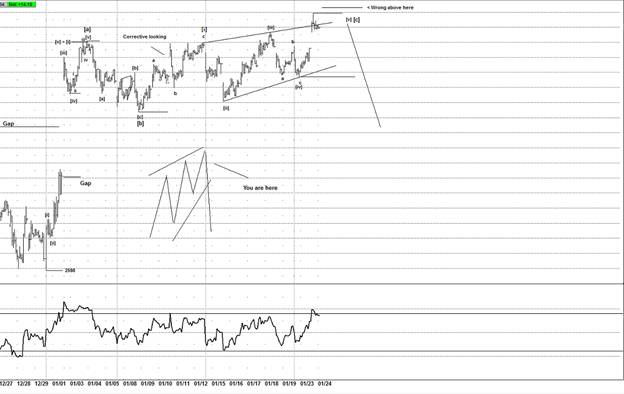
Earlier in the week I switched my thoughts to the NDX, as that has been showing considerable weak price action, and certainly does not appear to have the power behind it as we have seen on the DOW and SPX, I suspect it's a small by quiet clue that many traders probably are not watching.
We were watching for a potential ending diagonal setup and its set itself up just before the AAPL earnings, we had limited risk with the idea via the NQ futures for those that wanted to trade in Globex, although when trading ETFS and options you always have the risk of an overnight gap, it's something that traders have to accept when trading those vehicles.
The AAPL disappointment gave members the chance to sell a bounce in Globex after the gap down, which I suspect would happen, as generally what happens after a gap down is the shorts tend to cover and a light bounce is seen before more downside.
But I was still expecting more downside as the trend in AAPL is clearly down and will put pressure on the NDX, although many analysts seem to think AAPL does not matter anyone, I tend to disagree with that statement, AAPL is a major component of the NDX, if that really starts to crack lower as I expect, we should see $350 in a short space of time and on its way to my long term target of $80.
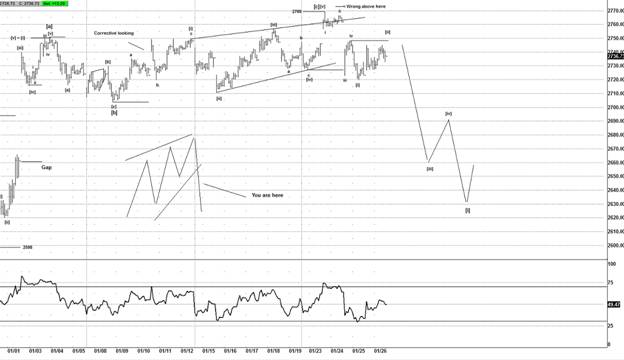
As of Fridays close we still have a setup in the NDX, which I think offers the better setup, as with this idea we have a clear risk control point at 2769.
With virtually all the setups I post for members I always put the emphasis on risk control, I think too many analysts dwell on what the potential profits could be seen and not enough on risk, risk is everything, finding strong, solid quality ideas takes a special skill, when an analyst can justify the risk, then I am interested, if they can't or have no clue, I simply brush any analysis I read these days.
So going into Mondays open I tend to think the NDX has the better setup, as the SPX has no clarity yet, whereas the NDX has shown us something we can use and we can control risk which is the important point.
With the SPX chopping around last week, I suggested to members that they look elsewhere for ideas and when markets are in chop land, I try to suggest to members to look for ideas where ideas present themselves with clear risk and objectives.
It should not matter which markets, as long as it's a strong idea I encourage members and traders alike to move to markets where the ideas has a strong setup.
AAPL
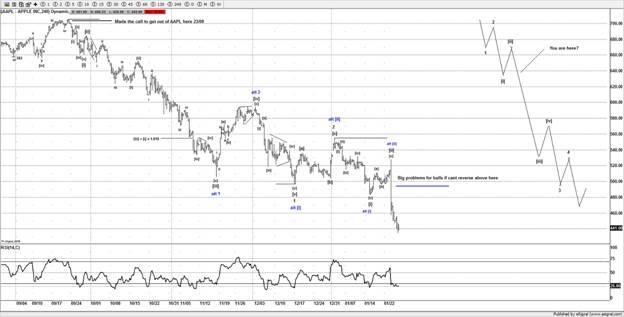
Talking of AAPL it still seems many bulls are in denial that "my precious" can actually go lower, when I first posted this chart of a comparison of AAPL and the NDX, the abuse I got was nothing short of amazing, emails and comments suggesting I was a tea leaves reader, I was an idiot, I was a prat for suggesting AAPL can go lower, AAPL can never go down as it's a cash cow, I think I read every excuse under the sun, some very amusing, it's surprising what a bit of contrarian analysis can invoke, but then I have seen this behavior many times before.
When I made my Silver and Gold calls to get out of the precious metals in 2011, I was getting the same sort of message and comments. In fact the more abuse I get I tend to think it just further confirms my analysis. Without the abuse I think I would be worried.
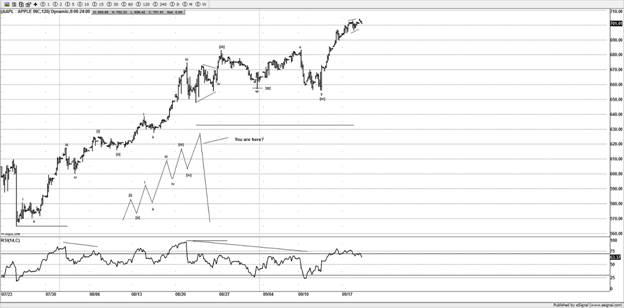
Fast forward and things working out as expected, and I still think AAPL could see lower, however that really is on the basis of seeing a failure to get back above $490-495, failure to get above that area is a bad sign for the bulls and if you are an owner of AAPL I would strong suggest you respect any failure and get out of AAPL.
I don't have any position in AAPL so this is not scare mongering, I warned many traders on my twitter stream that AAPL was going to crash, as ALL parabolic blow offs end in tears, but as usual it tends to fall on deaf ears, although my analysis did save a few members retiree account as they sold AAPL on my recommendation near $700, that alone was worth the effort of analyzing AAPL.
The price of membership for US market analysis is $20 a month, I guess to some traders $20 just is not worth saving your accounts, although moving from $700-450 must hurt if you bought AAPL at the highs, I seem to recall figures of $900 and $1100 posted, I guess they were not following my work huh!!, never mind it won't be long before another bubble in a stocks comes along.
Can you afford not to be without quality analysis?
Actually there are a few bubbles in some other stocks we have been following recently. We have actually started adding some US stocks to the US markets service; to date we have 22 US stocks that we are following.
Stocks such as: AAPL, GOOG, IBM, MSFT, BAC, GS, JPM, INTC, CVX, COST, VWM, SCRL, ULTA, CRM, EBAY, AEP, CMI, XOM, PLL, ISRG, AMZN and FB.
That is the current list we had added to the service, that along with daily analysis of the US markets I suspect makes it a bargain for $20 a month and you can still try before you buy as that service has a 4 week trial.
With some of the ideas still setting up, I suspect some great ideas are looming. So if you are an owner of the above mentioned stocks, it might just pay you to come inside and check out what we have to offer.
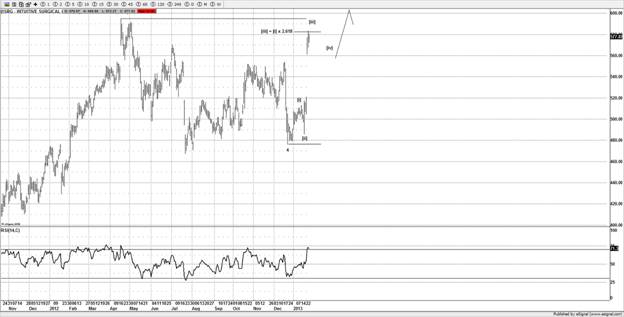
ISRG
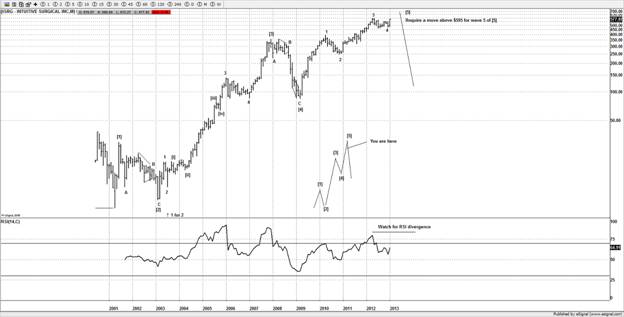
Another bubble in the making is ISRG, this stock still needs higher, but its long term idea suggests holders need to be on a high alert and start to look to take profits regardless of what analysts say.
Remember these were the same guys that were telling you to buy AAPL at $650 and $700 as its going to $1000 right? Wrong they could not care less, the more stocks you buy the more they get commissions, when was the last time your broker told you to lock in profits and sell a stock?
Righttttt! I never hear of one, if there is one, congratulations you have a gem of a broker.
So do you want to take the risk of this turning out to be another APPL? Or do you want some advice when is the best time to take profits?
A new high above $595 is needed, but I suspect it runs towards $600, the short term charts suggest that is most likely, but any new high above $595 technically completes this long term pattern.
Natural Gas (NG)
One such setup this past week was NG (Natural Gas), I had been looking for a minor high to NG for a few days and felt it could setup a decent trade short term. When it dumped, I suspected we could setup a low risk trade to sell with a stop at $3.64. As long as it stopped around the $3.58-60 area it gave members a decent trade.
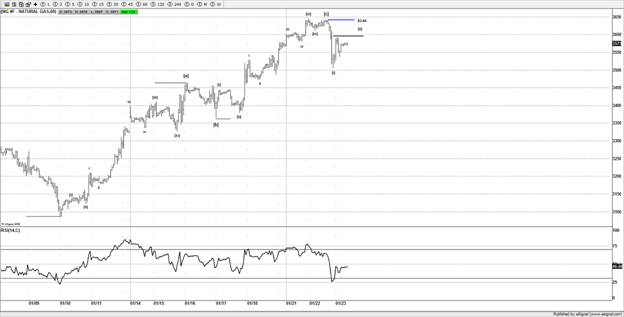
As it stands this turned out to be a nice trade, no matter if you used futures or CFDs, a nice profit was had with small risk, just the way we like them. I think it needs a bit lower for a 5th wave, then we could see a small upside correction, which should offer a setup to sell again, providing we see a 5 wave decline then a corrective bounce, that is a trade that traders can look to sell, as again we can limit risk as we have a control point.
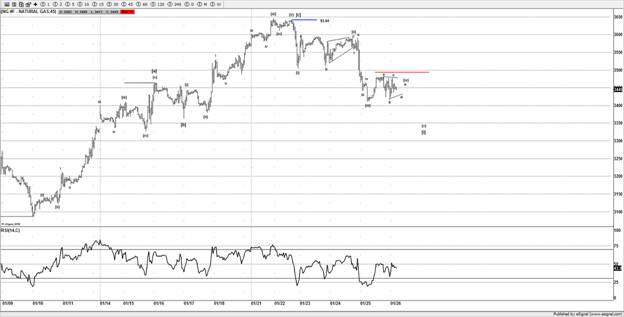
Staying under the red line suggests a 4th wave then I am expecting a new low, so we have tight risk control for those still in the trade, as those traders that are short from near $3.58 already have profits locked in.
If we get the new low, then traders can look to scale out and lock in the $$ as a bounce is likely to correct any 5 wave decline from $3.64.
Knowing where the idea is wrong is a big issue for me, as without it you are paddling up a creak without a paddle and that usually means you are going to run into trouble. If an analyst or trader doesn't know where an idea is wrong, they are guessing risk control and that is bad news for your account as emotions can play havoc when things go wrong, and anyone that thinks things can't go wrong clearly has not traded for a while.
So with a week of chop in the US markets, we still found 2 decent ideas, there were others as well, in forex as some of the JPY crosses have been seeing some amazing moves and we are liking the setups that some of those JPY crosses are showing us, that's something we are watching next week for a trade.
I will leave it there as I have rambled on long enough.
Until next time
Have a profitable week ahead.
Click here to become a member
You can also follow us on twitter
What do we offer?
Short and long term analysis on US and European markets, various major FX pairs, commodities from Gold and silver to markets like natural gas.
Daily analysis on where I think the market is going with key support and resistance areas, we move and adjust as the market adjusts.
A chat room where members can discuss ideas with me or other members.
Members get to know who is moving the markets in the S&P pits*
*I have permission to post comments from the audio I hear from the S&P pits.
If you looking for quality analysis from someone that actually looks at multiple charts and works hard at providing members information to stay on the right side of the trends and making $$$, why not give the site a trial.
If any of the readers want to see this article in a PDF format.
Please send an e-mail to Enquires@wavepatterntraders.com
Please put in the header PDF, or make it known that you want to be added to the mailing list for any future articles.
Or if you have any questions about becoming a member, please use the email address above.
If you like what you see, or want to see more of my work, then please sign up for the 4 week trial.
This article is just a small portion of the markets I follow.
I cover many markets, from FX to US equities, right the way through to commodities.
If I have the data I am more than willing to offer requests to members.
Currently new members can sign up for a 4 week free trial to test drive the site, and see if my work can help in your trading and if it meets your requirements.
If you don't like what you see, then drop me an email within the 1st 4 weeks from when you join, and ask for a no questions refund.
You simply have nothing to lose.
By Jason Soni AKA Nouf
© 2013 Copyright Jason Soni AKA Nouf - All Rights Reserved
Disclaimer: The above is a matter of opinion provided for general information purposes only and is not intended as investment advice. Information and analysis above are derived from sources and utilising methods believed to be reliable, but we cannot accept responsibility for any losses you may incur as a result of this analysis. Individuals should consult with their personal financial advisors.
WavePatternTraders Archive |
© 2005-2022 http://www.MarketOracle.co.uk - The Market Oracle is a FREE Daily Financial Markets Analysis & Forecasting online publication.