Commodities Pushing Through New Highs
Commodities / CRB Index Mar 03, 2008 - 10:24 AM GMTBy: Donald_W_Dony
 KEY POINTS:
• CRB breaks to new ground above old resistance
• Agriculture remains strong, supported by
immerging secular trends
• Oil back to $100 and over, as upward
pressure builds
• Base metals remain flat, with recession
starting in U.S.
• Gold pushing to $1,000 target by mid-year
With the rolling over of the recent global equities markets, and the expectations of lower numbers during the next one to two years, I find great comfort in focusing on a market that is not stock-market co-ordinated.
The secular advance in commodities is driven by many long-term macro issues. The falling U.S. dollar was the match, but the fuel has come from explosive building demand from Asia (home to more than one-third of the world’s population), two decades of reduced exploration and production, higher food demand, and, in the case of oil, ,a serious lack of new onstream supply. All of this combines to create the ‘perfect storm’ for raw materials.
No stopping the Bull

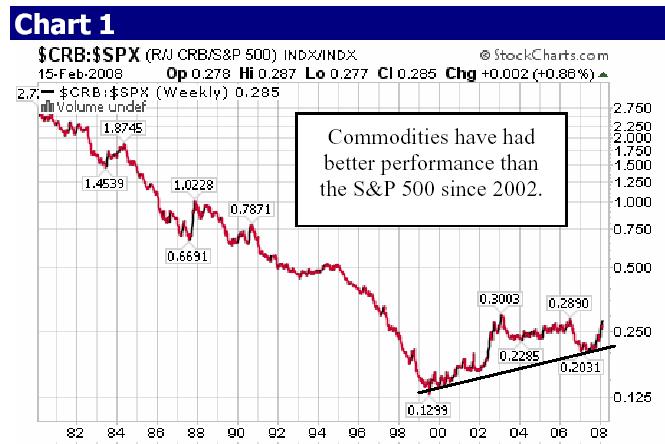
Chart 1 illustrates the relative strength performance of the Commodity Research Bureau (CRB) Index over the paper-based S&P 500. This chart, which dates from 1980, dramatically demonstrates the shift of power, starting in 2002. A falling line (1980 to 2002) shows that the S&P had control (higher performance than the CRB) – and for more than 20 years. But beginning in 2002, the rising line (2002 to present) shows that there’s a new ruler in town; the reign of power has been handed over to commodities. Tangibles are clearly outperforming the S&P 500.
And the good news (provided you like commodities) is that these secular trends, historically, last about 15 to 20 years. This means that investors will most likely find the best performance for their portfolios over the next decade coming from raw-materials sectors, not the S&P 500 and NASDAQ, as in the 1980s and 1990s.
TS Model Growth Portfolios update

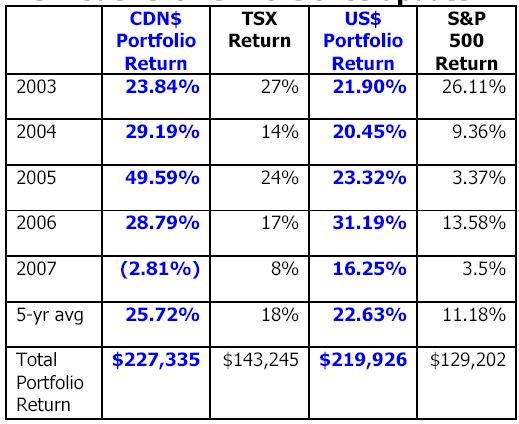
This is one of the main reasons that the TS Model Growth Portfolios have performed so well over the past five years (see the performance comparison chart at the top of this page). They have dramatically surpassed the performance of the TSX Composite, and especially the S&P 500.
Go to www.technicalspeculator.com and click on member login to download the full 14 page newsletter.
Your comments are alway welcomed.
By Donald W. Dony, FCSI, MFTA
www.technicalspeculator.com
COPYRIGHT © 2008 Donald W. Dony
Donald W. Dony, FCSI, MFTA has been in the investment profession for over 20 years, first as a stock broker in the mid 1980's and then as the principal of D. W. Dony and Associates Inc., a financial consulting firm to present. He is the editor and publisher of the Technical Speculator, a monthly international investment newsletter, which specializes in major world equity markets, currencies, bonds and interest rates as well as the precious metals markets.
Donald is also an instructor for the Canadian Securities Institute (CSI). He is often called upon to design technical analysis training programs and to provide teaching to industry professionals on technical analysis at many of Canada's leading brokerage firms. He is a respected specialist in the area of intermarket and cycle analysis and a frequent speaker at investment conferences.
Mr. Dony is a member of the Canadian Society of Technical Analysts (CSTA) and the International Federation of Technical Analysts (IFTA).
Donald W. Dony Archive |
© 2005-2022 http://www.MarketOracle.co.uk - The Market Oracle is a FREE Daily Financial Markets Analysis & Forecasting online publication.


