


Stock Markets at Extreme Levels, Asset Class Correlations
Stock-Markets / Stock Markets 2013 Feb 03, 2013 - 07:31 AM GMTBy: Tony_Pallotta

 For the week ending February 1, 2013, the SPX was up 0.7%, the Russell small caps were up 0.6% and the COMP was up 0.9%.
The only noticeable divergence within the indices is the Nasdaq 100 which has failed to take out prior highs and has shown a clear loss of momentum. Technically it has not violated support and therefore remains in an uptrend.
Other indices also remain in an uptrend as daily support has not failed though they too are showing a loss of upside momentum. If you are long equity, stops that are recommend are roughly 1,490 on the S&P500, 895 on the Russell and 3,140 on the Composite.
FX markets are fueling risk as the JPY pairs are at an extreme overbought level. Position data is confirming that a trend reversal in USD/JPY is probable. As a result the model remains flat here as the risk reward is not currently favorable for equity markets.
Asset Class Correlations
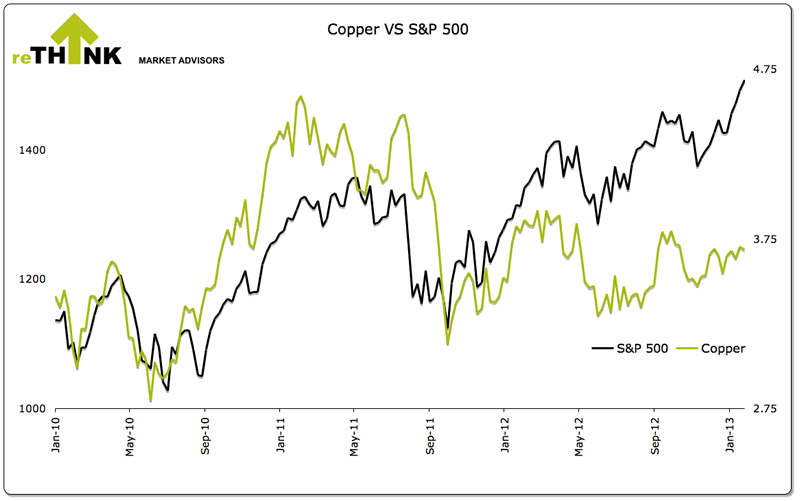
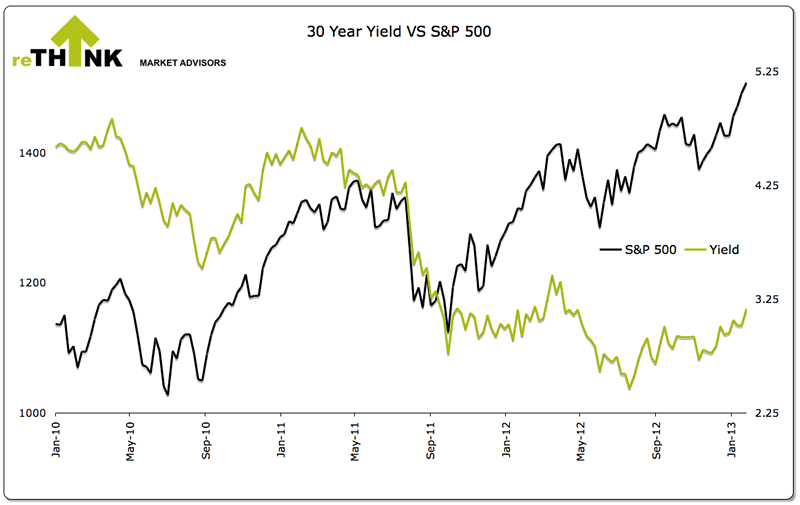
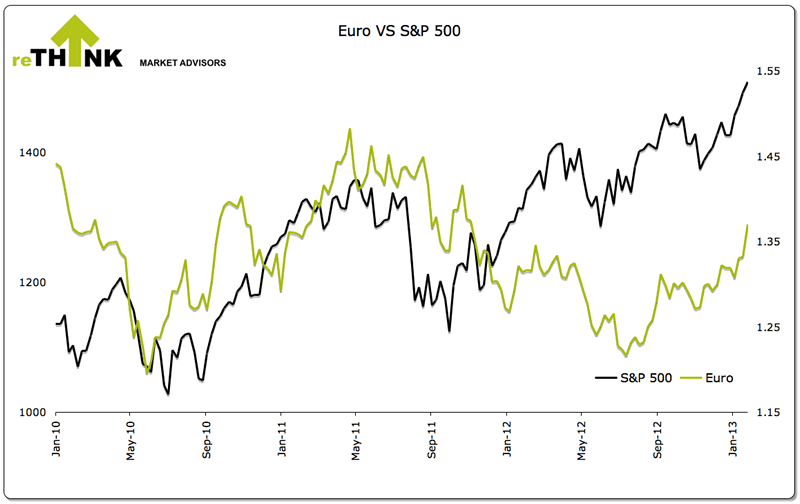
For the week ending February 1, 2013, the EUR was up 1.3%, copper was up 3.3%, 30 year yield was up 8bp and the Aussie Dollar was down 0.2%.
The model has triggered short AUD/USD which will likely put downward pressure on the JPY pairs next week and pressure copper and yield lower. The EUR remains in an uptrend and the dollar is technically short though we anticipate as part of a JPY unwind a short EUR and long DXY in the foreseeable future.
The multi-month divergence with equity and the EUR, AUD, copper and 30 year yield remains. As a result equity may show greater relative weakness as part of any future asset class convergence. Using any of these asset classes as a directional indicator may likely produce false signals. Our preference is to use JPY pairs.
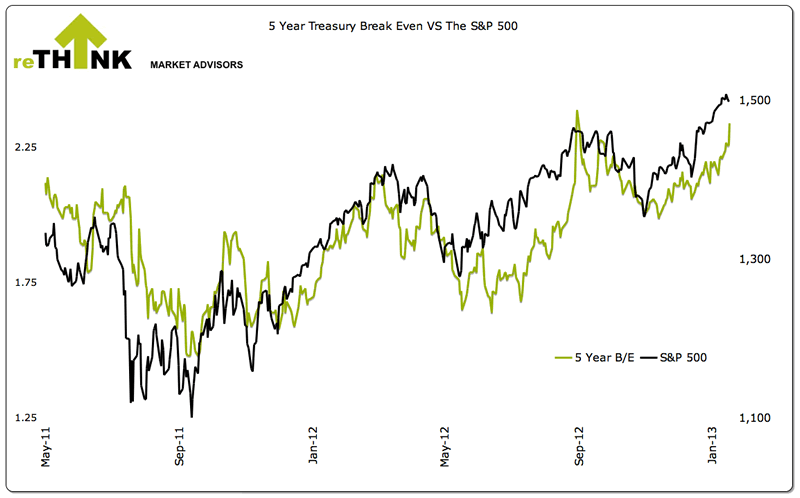
There remains a divergence with the 5 year Treasury break even though they did rise 13bp on the week thus reducing this divergence.
Sentiment
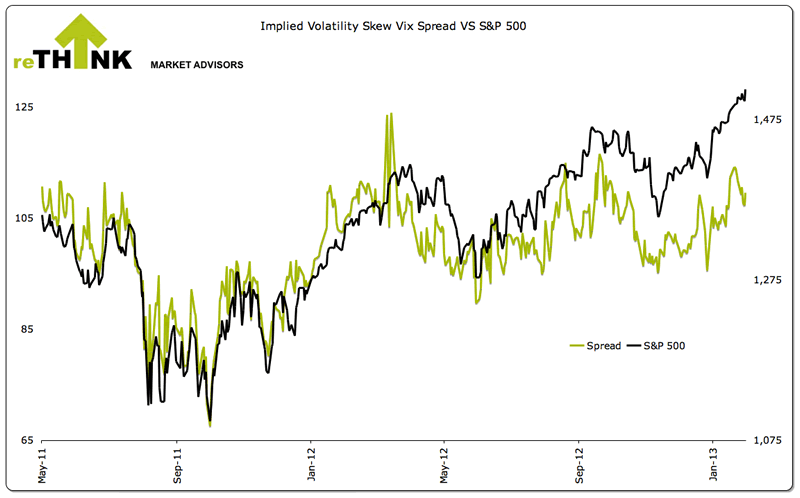
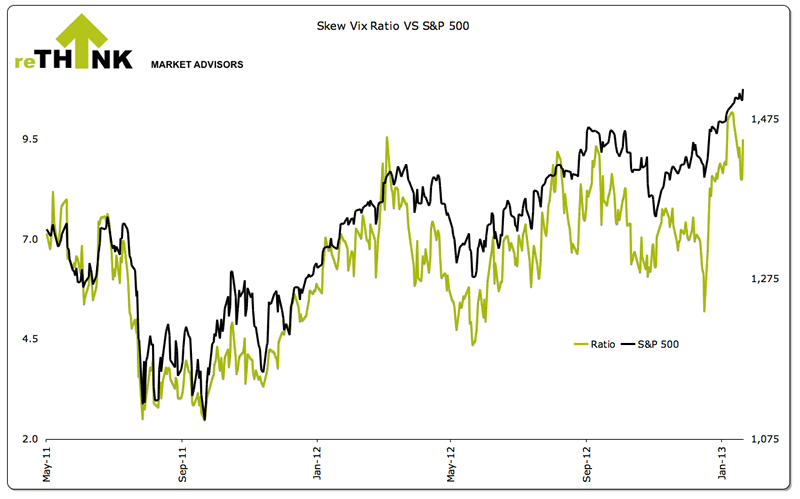
Market sentiment remains extremely complacent as viewed through the options market with the VIX at a 6 year low. Implied volatility skew though has been rising averaging 122.60 for the week and closing at 122.55.
Skew is a measure of how implied volatility is distributed. The lower the reading the less skewed the curve, indicating a normalized distribution.
Funds Flow
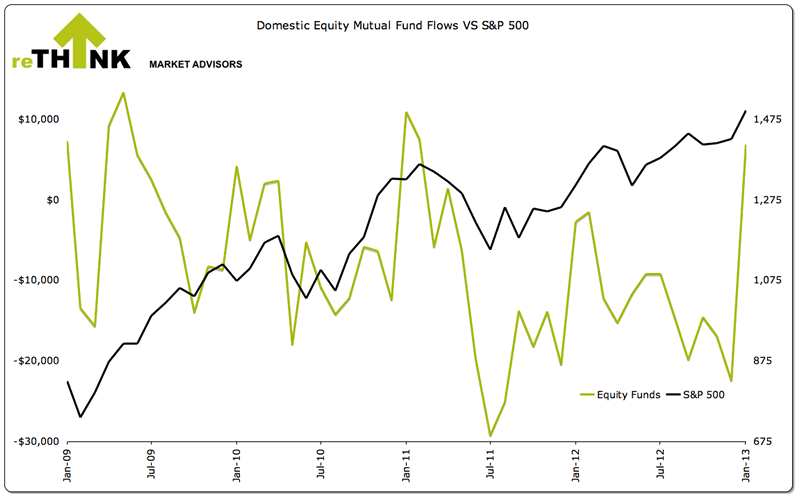
For the period ending January 24, 2013, $3.5 billion flowed in to domestic equity funds while $8.0 billion flowed in to both municipal and taxable bonds. After nearly a year of continuous equity outflows, this is the third consecutive inflow into domestic equity funds.
For the month of December, domestic equity funds had a net outflow of $22.0 billion while bond funds had a net inflow of $9.8 billion. For 2012, domestic equity funds had a net outflow of $149.3 billion while bonds funds had a net inflow of $295.4 billion.
Bottom Line
Equity markets are technically in an uptrend as are all asset classes. But with the extreme levels on all major JPY pairs the model remains flat equity. We view other asset classes more favorable from a risk reward standpoint.
JPY cross pairs need to be monitored closely for any signs of an unwind. They remain highly stretched at current levels with COT data confirming a probable reversal. This will pressure other risk assets ahead of the general equity markets.
About The Big Picture: All technical levels and trends are based upon Rethink Market Advisor models, which are price and momentum based. They do not use trend lines nor other traditional momentum studies. To learn more about how the models work, please click here or visit http://rethink-markets.com/model-profile
© 2013 Copyright Tony Pallotta - Disclaimer: The above is a matter of opinion provided for general information purposes only and is not intended as investment advice. Information and analysis above are derived from sources and utilising methods believed to be reliable, but we cannot accept responsibility for any losses you may incur as a result of this analysis. Individuals should consult with their personal financial advisors.
Tony Pallotta Archive |
© 2005-2022 http://www.MarketOracle.co.uk - The Market Oracle is a FREE Daily Financial Markets Analysis & Forecasting online publication.