How to Invest Within Kress Cycle 2014 Stock Market Crash
Stock-Markets / Financial Crash Feb 04, 2013 - 09:35 AM GMTBy: Clif_Droke
 Recently I asked a question that I suspect many followers of the Kress cycles have asked at some point. Here it is:
"I have been following your discussion on the Kress cycles for years. When I combine the market analysis from other [financial analysis] sources I am somewhat perplexed, however. I would desperately desire to make a keen strategic maneuver in the next 24 months with my retirement funds to, first, avoid the next crash predicted by the "hard down" phase of the Kress cycle. But then secondly, I'd like to be in the market to take full advantage of the ensuing bull market.
"If I fully believe the Kress 2014 crash scenario and pull out completely in the coming months, my past luck would have me completely miss the Raging Bull market. On the other hand, if I commit to being in the market to ride the Bull, I could get annihilated again if Kress's 2014 crash is as predicted....
"Can you please expound on how a long term investor, like me, can negotiate this coming period to minimize the risk of being on the wrong side of the wave when it gets here? I'm feeling like a deer in the headlights and I'll bet I'm not alone."
To answer this question, I would reiterate that the Kress cycles - indeed, no theory of market cycles - should be used exclusively to make investment, or especially, trading decisions. As I've stated many times before, the yearly Kress cycles should be viewed as a rough guideline, or road map, for the overall market path. More specifically, only when any of the major yearly cycles within the 120-year Kress cycle series are "hard down" should you consider embracing a bearish market stance.
For instance, if the 10-year cycle is scheduled to bottom (as it last did in 2004 and will again in 2014) then you can become increasingly defensive in your market posture as the cycle bottom approaches in (especially) the second and third quarters of the cycle bottom year. Conversely, if a major cycle is peaking (as the 10-year cycle did in 2009), then you can probably safely maintain a bullish posture through much of the year.
The final "hard down" phase of any of the yearly cycles is partly determined by the configuration of the Kress weekly and quarterly cycles. It helps to know the position of these cycles when evaluating the coming market year on an annual basis. There is some validity, however, in assuming a net bearish market stance as we approach the final year of the 120-year bottom, namely the year 2014.
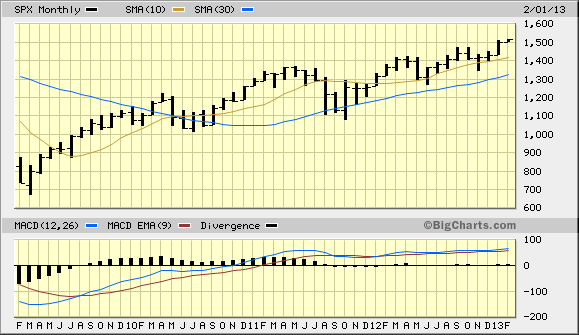
How can an investor know when to exit his long positions and return to a net short or all-cash position? Answer: By employing a disciplined technical trading approach to the stock market. For instance, even if you believe 2013 will be an extremely volatile year as it progresses due to the conflicting cyclical and economic currents (as I do), you can still maintain a net bullish investment posture as long as your stocks and ETF positions are, for instance, staying above the rising 10-month or 30-month moving averages. See chart example below.

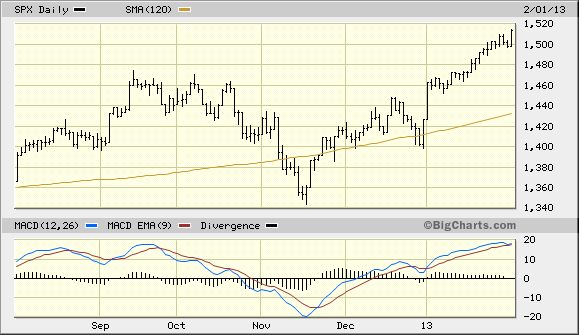
Another strategy that Bud Kress and I discussed many years ago was that of maintaining a bullish market posture - from an intermediate-term investment standpoint - as long as the 120-day moving average in the S&P 500 Index is in a rising trend. Students of the Kress cycles will of course instantly recognize the numerological significance of 120 as this number correlates to the Kress 120-day, 120-week and 120-year cycles.

If you wanted to play it closer to the hip, you could even use the 30-day and 60-day MA combo to enter or exit trading positions within a volatile year. (FYI, I employ a similar technical discipline in the Momentum Strategies Report in order to participate in rallies even in bear market years). Remember, just because a major yearly cycle is in the "hard down" phase doesn't necessarily mean that all stocks will be declining. As the old Wall Street saying goes, "There's always a bull market out there somewhere." This is why it pays off to vigilantly scan the charts of actively traded NYSE and NASDAQ stocks regularly for trading opportunities.
In short, don't let the Kress cycles dictate your short-term trading or investment decisions unless there is valid reason for doing so (e.g. the cycle is in the final stage of bottoming).
2014: America's Date With Destiny
Take a journey into the future with me as we discover what the future may unfold in the fateful period leading up to - and following - the 120-year cycle bottom in late 2014.
Picking up where I left off in my previous work, The Stock Market Cycles, I expand on the Kress cycle narrative and explain how the 120-year Mega cycle influences the market, the economy and other aspects of American life and culture. My latest book, 2014: America's Date With Destiny, examines the most vital issues facing America and the global economy in the 2-3 years ahead.
The new book explains that the credit crisis of 2008 was merely the prelude in an intensifying global credit storm. If the basis for my prediction continue true to form - namely the long-term Kress cycles - the worst part of the crisis lies ahead in the years 2013-2014. The book is now available for sale at:
http://www.clifdroke.com/books/destiny.html
Order today to receive your autographed copy and a FREE 1-month trial subscription to the Momentum Strategies Report newsletter.
By Clif Droke
www.clifdroke.com
Clif Droke is the editor of the daily Gold & Silver Stock Report. Published daily since 2002, the report provides forecasts and analysis of the leading gold, silver, uranium and energy stocks from a short-term technical standpoint. He is also the author of numerous books, including 'How to Read Chart Patterns for Greater Profits.' For more information visit www.clifdroke.com
Clif Droke Archive |
© 2005-2022 http://www.MarketOracle.co.uk - The Market Oracle is a FREE Daily Financial Markets Analysis & Forecasting online publication.


