


How to Make Money in Super Cycle Stocks Bear Markets
InvestorEducation / Learning to Invest Mar 03, 2008 - 04:57 PM GMTBy: Bob_Bronson

 The stock market has essentially gone sideways since its March 24, 2000 high almost eight years ago. In fact, it has spent 99% of the time below that high and because profitable market timing is so difficult for most investors they have typically lost money during this time period.
[This is a correction, update and expansion of the report posted 9/25/07]
 Meanwhile, our buy-and-hold (no turnover) model portfolio of four asset-class based, no-load mutual funds, which we've been continuously recommending for the past eight years, has gained 84% through Feb 29, 2008, without any drawdown exceeding 10%. [i] The four funds held reflect our continuous bullish position on bonds (VBLTX) and precious metals, especially gold, (VGPMX) and bearish positions on the U.S. dollar (ICPHX) and the stock market, especially technology (RYAIX). Also, some 50% of the portfolio is internationally based.
Our currently recommended portfolio, with very low volatility and maximum drawdown in a simple unrebalanced buy-and-hold strategy, is very different from the high-performance one that we developed for the last Supercycle Bear Market Period starting in the mid-1960s.
Our previous model was based on a proprietary formulization of alpha/beta-based relative strength stock selection, augmented with simplistic market timing, rather than the strategic asset class diversification with no market timing employed in our current model portfolio. Its 20-fold growth, or 53% annualized performance, illustrated in the second chart below, was in sharp contrast to virtually no gains in the stock market during the less than eight-year period from 1966 through July 18, 1973. A copy of our July 20, 1973 report explaining our stock selection methodology and the transactional details of the 10-stock model portfolio is available upon request in a 21-page Word file.
The operational simplicity of our current model portfolio strategy compared to our previous relatively high turnover, momentum-based strategy of four decades ago is deceiving since it requires long range anticipation of how institutional investors will likely change their mind in reaction to the dynamic fundamental forces that drive the economy and various capital markets during multiple business expansions and contractions.
In order to have roughly equal volatility impact from each of the four active positions in the portfolio and to keep the portfolio's maximum drawdown under 10%, the initial allocations were 5% in very volatile VGPMX, 12.5% each in VBLTX and RYAIX, 20% in ICPHX, and 50% in virtually non-volatile U.S. money market funds.
The money market funds keep the portfolio volatility very low – to less than half of the stock market – and such interest income covers management fees without drawing down any principal, an important feature for many investors, especially those in retirement. Also the cash reserves can be used to further control and take opportunistic advantage of the extremely high volatility that typically occurs during bear market selling panics. We'll explain how this can be done when such a selling panic, like a MCHVIE, [ii] is on the immediate horizon.Our current model portfolio is uniquely very adaptive to most any investor situation since, on average, it has been virtually uncorrelated to the stock market and thus has a beta of zero. [iii]
So if one is not very concerned about drawdowns and/or holding money market funds is not desirable, then doubling the allocation percentages for the four active positions yielded 47% higher portfolio performance of 11.7%/year, which resulted in a 76% higher alpha at 8.6%. [iv]
Alpha derived from correlation-related volatility risk (i.e., beta) is a useful metric, but we have found maximum high-to-low drawdowns and other downside volatility risk metrics to be even more valuable to investors.
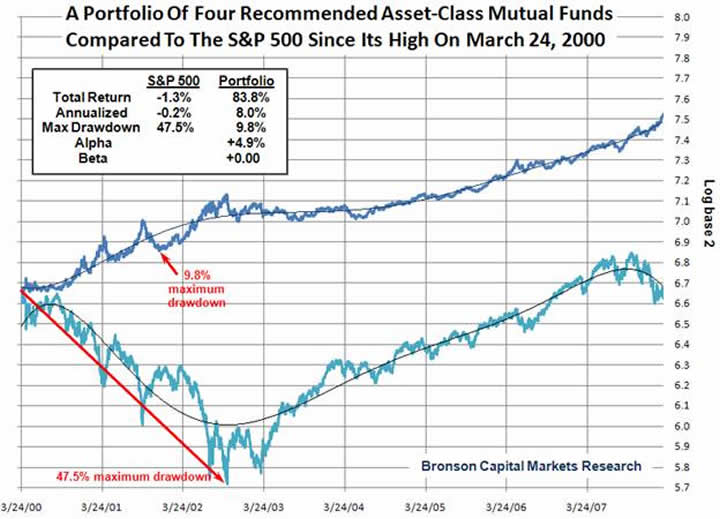
For example, the allocations in our model portfolio were selected to hopefully avoid drawdowns that exceed 10% from the highest daily closing high value to the subsequent lowest daily closing low value. (No guarantee, of course.) Since March 24, 2000, the stock market's maximum drawdown, as measured by Vanguard's S&P 500 total return index, has been 47.5%. On a compounded basis, it takes 6.2 times our model portfolio's maximum drawdown of 9.8% to equal that 47.5%! Thus, by this more meaningful metric our model portfolio has been only 1/6 as risky as the stock market during the past almost eight years.
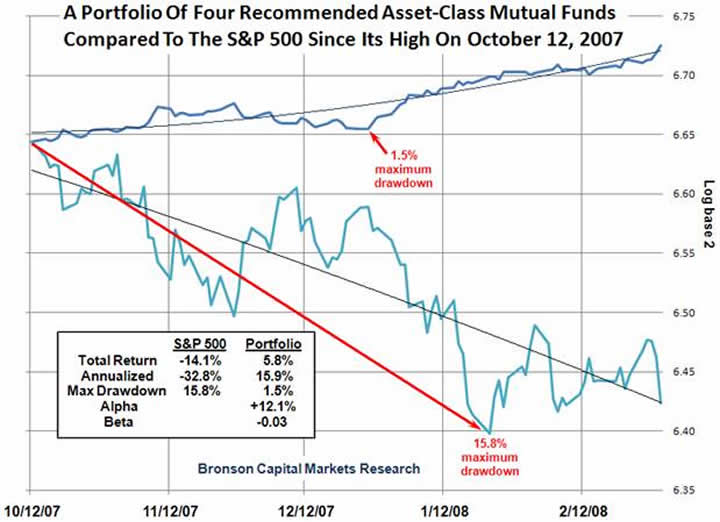
Also, unlike most any other investment strategy, rebalancing our model portfolio is not much of an issue as reflected by comparing the first two charts below. Since what we call the “irrational complacency” driven echo-mania intraday high on October 12, 2007, the second chart shows that the 5.8% in our rebalanced model portfolio's performance is roughly similar to the 6.9% gain in our unrebalanced model portfolio. These gains have been during the same 4.5-month period through February 29, 2008 during which the stock market has declined 14.1%.
As a consequence, the curvilinear best fit lines (thin black lines in the first two charts below) illustrate that our model portfolio – unrebalanced or rebalanced -- is accelerating its outperformance of the stock market -- like it did in 2001 and 2002 – without margin or trading or paying commissions.
All of this goes to show that there are several ways of making money in Supercycle Bear Market Periods, both aggressively and conservatively. Of course, the reality is also that there are many more ways to lose money during such extended and volatile under-performance periods for the stock market. We fully expect the current Supercycle Bear Market Period to persist for several years - probably another seven years to Oct 2014 - and for our model portfolio to continue to outperform, especially on a risk-adjusted basis.
Bob Bronson
Bronson Capital Markets Research
[i] We measure maximum drawdown using daily portfolio values. Using longer time intervals, like month-end data, typically hides the highs and lows that occur on an intra-month basis. For example, the 47.5% maximum drawdown for the VFINX, Vanguard's total return index for the S&P 500 index from its Mar 24, 2000 high to its Oct 9, 2002 low is 8% higher than the 43.8% computed using the Mar 31, 2000 month-end high to its Sep 30, 2002 month-end low. Similarly, the maximum drawdown for our model portfolio was 8.3% using month-end data, which is over 15% lower than the 9.8% derived from using daily data.
[ii] A MCHVIE is a Mass-Correlation, Hyper-Volatility, and Illiquidity Event that we expect to end the current Supercycle Bear Market. Subscribers to our private e-mail list will receive more descriptive info about the coming MCHVIE.
[iii] Beta is the product of the correlation and the ratio of the standard deviations of the portfolio and the stock market. So while our portfolio has exhibited a daily standard deviation of 0.49% compared to the stock market's standard deviation of 1.10%, since the correlation coefficient has been only 0.006, the portfolio beta has been only 0.0026, or essentially zero.
[iv] Since the portfolio's beta is essentially zero, on average, the portfolio's all-important alpha, or beta risk-adjusted annualized return, is simply equal to its annualized total return in excess of the risk-free return. Alpha equals the portfolio's excess return minus beta times the stock market's excess return, where in each case excess return is the total return minus the risk-free rate of return (e.g., 90-day T-Bills or money market mutual fund returns).
By Bob Bronson
Bronson Capital Markets Research
bob@bronsons.com
Copyright © 2008 Bob Bronson. All Rights Reserved
Bob Bronson 's 40-year career in the financial services industry has spanned investment research, portfolio management, financial planning, due diligence, syndication, and consulting. At age 23, he and his partner founded an investment research firm for institutional clients and were among the first to use mainframe computers for investment research, especially in the areas of alpha-beta analysis and risk-adjusted relative strength stock selection. Since 1967, he has served as an investment strategist and consultant to various investment advisory firms and is the principal of Bronson Capital Markets Research. If you wish to read more, read his BIO
A note to visitors ~ We do not have a website, but we maintain a private e-mail list. I'm also often asked why we provide research and forecast information for free. Since we are not looking for new business from the internet, I periodically post some of our research and forecasts in exchange for feedback from others. And since we don't publish in academic or industry trade journals, such internet discussion gives us as much peer review as we want and can conveniently assimilate at this time.
Also, the few archiving discussion boards in which I have the time to participate give us new ideas and allow us to establish and maintain intellectual property copyrights for our proprietary research, and to establish a verifiable forecasting record. At the same time, we are able to publicly document our forecasts and help others who otherwise don't have access to our work.
To be added to our private e-mail list, we only ask that you periodically provide feedback: questions, comments and/or constructive criticism to keep our research work and forecasts as error-free, readily comprehensible and topically relevant as possible. If you would like to be added, please explain, at least briefly, what you do, since our e-mailing list is categorized by the backgrounds of the recipients.
Robert E. Bronson, III Archive |
© 2005-2022 http://www.MarketOracle.co.uk - The Market Oracle is a FREE Daily Financial Markets Analysis & Forecasting online publication.