Gold And Silver $1600 And $28 Buy Targets
Commodities / Gold and Silver 2013 Feb 10, 2013 - 11:52 AM GMTBy: Michael_Noonan
 If Venezuela were any guide, we would have to say buy gold and silver, right here, right now! [VENEZUELA DEVALUES FROM 4.30 TO 6.30 BOLIVARS] For those of you who hold Bernanke Bux, aka fiat paper, pay close attention. Those Venezuelan citizens who held paper Bolivars took a 46% hit on their purchasing power. Those citizens there who held gold and silver saw an equivalent 46% jump in their holdings. If you think it cannot happen here, you are wrong. It already has.
Since the privately owned Federal Reserve took control over this nation’s money supply in 1913, today’s purchasing power of the fiat-issued Federal Reserve Note, [FRN], is 3 cents, and that would be 3 cents of post-1982 pennies because pennies prior to 1983 are copper content and now worth more than 3 cents, not to put too fine a point on it. Always remember, a FRN is NOT a “dollar,’ despite the false labeling. Each one is a commercial debt instrument issued by the Federal Reserve, a central bank, one of many throughout the world, all controlled by New World Order confiscators, which includes confiscation of all freedom, [read the Patriot Act and National Defense Authorization Act, and we will not even go into the organic Constitutional Republic being defunct because of them].
Still, the likelihood of another devaluation of the FRN, but an “official” one, like what happened in Venezuela, as high as 50% would not be out of the realm of possibility. Anyone who still “values” the holding of valueless paper and has not purchased gold and silver in physical form, lives in denial and will “pay” dearly for that choice.
Let us be clear, once more, [with apologies to the choir members], BUY physical gold and silver, now, at any price and at any time, and put it away…NOT in a bank or some financial institution; NOT in any paper form, ETF or any “certificate of ownership” form, which is just a piece of paper. If you do not hold it, you may never get to own it! Is that worth the risk? [Just ask Germany, unable to get its gold back from central banks in NY and London.] No honor among thieves, there.
Here is one more fact for you to consider: $16, 483, 729, 858, 642. That is how many fiats are outstanding, a part of which the corporate federal government says is YOUR burden. [We warned you, FRNs are IOUs]. It is approximately the current cost of kicking the political can down the road in order to pay for all the banking failures, and government spending, the cost of funding the TSA to pat you down literally while politicians do it to you figuratively, and you can see how high those figures are. The examples are endless, and mindless.
As for the futures…we start each week with new charts, expecting developing market activity will lead us in the right direction. Previously, we have maintained a bullish bias when reading the charts. Not so, for this week.
[The long positions, acknowledged last week, were sold on the Wednesday rally, missing the break on Thursday and Friday.]
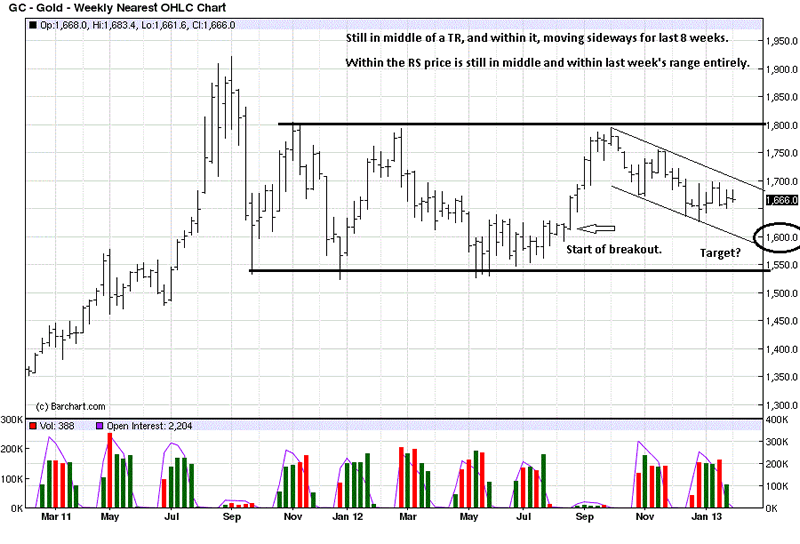
One cannot remain bullish for the near term, for futures only, when the developing market activity tells a story of price weakness. The least amount of market knowledge arises when price is in the middle of a TR. Why? The middle of anything is at a 50% point, so the odds of the market going up are equal to the odds of the market going down, while still within a trading range.
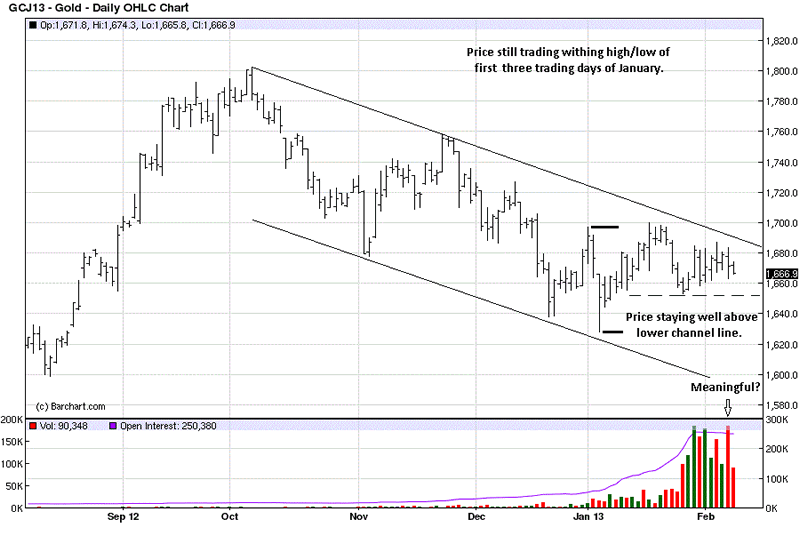
As you can see from the established channel, price could decline and not find support until the $1600 area, which is where the rally began, last August. We often say how markets are always testing support/resistance areas, and that includes previous breakout areas, too. As things stand, a further decline in the futures is not far-fetched, although why gold and silver would decline by any amount, given surrounding circumstances, is a mystery. Still, it speaks to the staying power of those in power who desire to keep PMs suppressed. It is still working.

While silver had been a bit stronger than gold, recently, gold held better on the late week decline than did silver. Seeing how gold has been virtually sideways since mid-December, and trading within the first three trading days of January, it can continue to meander for several more weeks to come.
One red flag was the sharp volume increase on Thursday with a close off the lows. It is the market telling us that buyers were as active as sellers, and meeting the effort of sellers at the lower end. Friday’s small range does nothing to clarify the picture.
Buy the physical, keep the powder dry in futures.

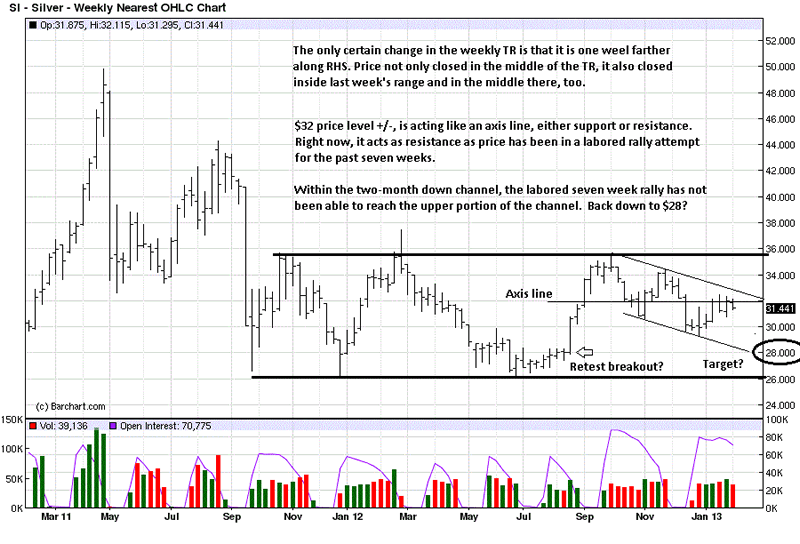
The weekly chart is similar in silver, but we added an “axis line,” one where it acts as support and alternating resistance, and that area is around $32. The labored rally from last week fizzled, and were price to decline, an obvious target is $28, also where the rally started in last August. This is should the December lows not hold as support.

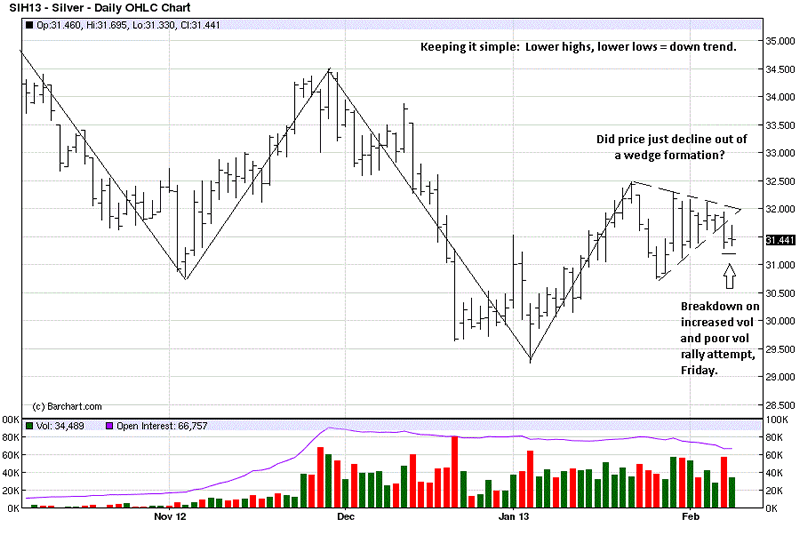
Keeping it simple, we see lower highs and lower lows, the simplest definition of a down trending market. We had been watching the formation of a coiling wedge for the past several trading days, even “hoping” for an upside breakout, but so far, the opposite has developed.
The increased volume on Thursday’s decline looks more like a day that sellers were in control, in contrast to the same day for gold. Friday’s attempt to rally failed, volume declined, and that says demand was weak. As an otherwise inside day, it is hard to draw any meaningful conclusion.
Buy the physical, and the American Eagles are such beautiful coins, but avoid futures for the near term.

By Michael Noonan
Michael Noonan, mn@edgetraderplus.com, is a Chicago-based trader with over 30 years in the business. His sole approach to analysis is derived from developing market pattern behavior, found in the form of Price, Volume, and Time, and it is generated from the best source possible, the market itself.
© 2013 Copyright Michael Noonan - All Rights Reserved Disclaimer: The above is a matter of opinion provided for general information purposes only and is not intended as investment advice. Information and analysis above are derived from sources and utilising methods believed to be reliable, but we cannot accept responsibility for any losses you may incur as a result of this analysis. Individuals should consult with their personal financial advisors.
Michael Noonan Archive |
© 2005-2022 http://www.MarketOracle.co.uk - The Market Oracle is a FREE Daily Financial Markets Analysis & Forecasting online publication.


