Imminent Stock Market Correction Expected
Stock-Markets / Stock Markets 2013 Feb 11, 2013 - 12:17 PM GMTBy: Andre_Gratian
 Current Position of the Market
SPX: Very Long-term trend - The very-long-term cycles are down and, if they make their lows when expected (after this bull market is over) there will be another steep and prolonged decline into late 2014. It is probable, however, that the severe correction of 2007-2009 will have curtailed the full downward pressure potential of the 120-yr cycle.
Intermediate trend - It is probable that the intermediate correction ended at 1398 and that a new uptrend is in progress which could carry a little further after a correction. However, it is also possible that we are putting an end to the move which started at 1343.
Analysis of the short-term trend is done on a daily basis with the help of hourly charts. It is an important adjunct to the analysis of daily and weekly charts which discusses the course of longer market trends.
Market Overview
Cycles: The 66-wk cycle continues to dominate the trend, and it is possible that the cycles which were due in the first week of February have inverted. Cycles bottoming over the next couple of weeks should be ready to assume control of the trend over the short term.
Projections: "The small base that was created in the process gave the index the means to reach as high as 1522 on this move, but the 1514/1515 level could stop the rally..." which it did, causing a pull-back to 1395. After some additional consolidation, SPX resumed its uptrend and now looks as if it means to reach 1522 before correcting. Should we be ready to reverse, a correction of about 50-points is the most likely scenario.
Structure: The short-term structure suggests a high in the vicinity of 1522. This will be confirmed if a reversal takes place from that level. It is unclear if we are in the process of completing a move from 1398 or from 1343.
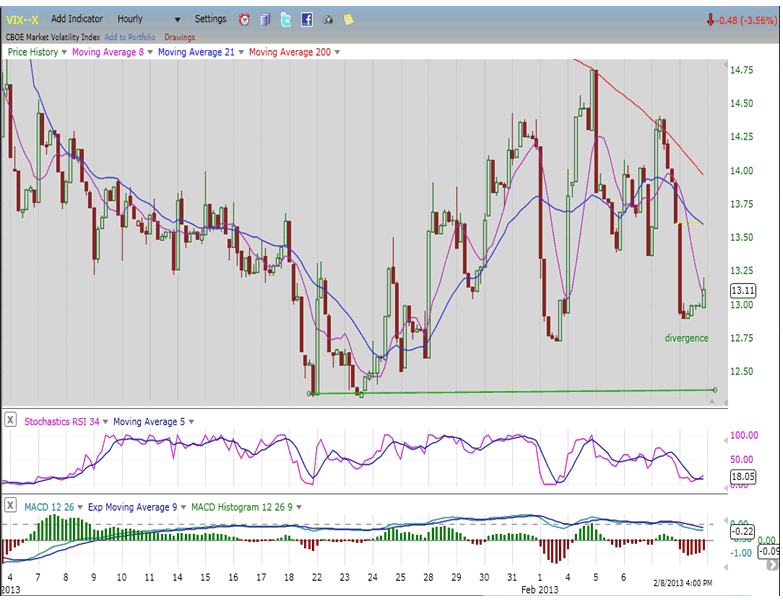
Sentiment: With this week's action, VIX continues to base and has created a count on a 1/2 point box P&F chart which potentially allows for a move to about 18.00-18.50 (should it reverse from Friday's low). In addition, the basing pattern in VIX was achieved with increasing positive divergence vs. SPX and significant negative divergence in XIV -- conditions which generally occur when the market is ready to correct.
Indicators: As of Friday's close, hourly indicators were overbought with a loss of momentum in the A/Ds resulting in negative divergence.
The daily indicators - both momentum and breadth - are now showing strong negative divergence to price. This, combined with overbought hourly indicators and the fact that the DOW failed to follow SPX to a new high on Friday are all bearish warnings which should be heeded.
Chart Analysis
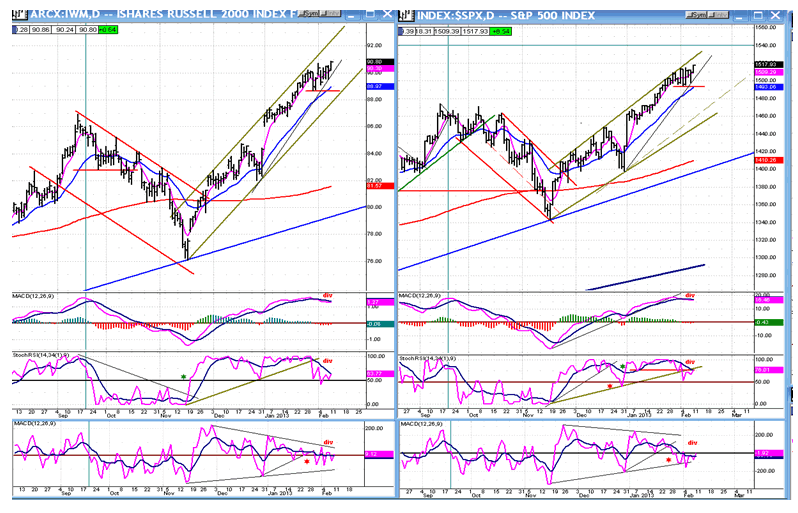
We'll start by comparing the price action of SPX vs. the Russell 2000 (charts courtesy of Qcharts). Both indices are still in strong intermediate-term uptrends of similar nature. The only slight difference is that SPX appears a little stronger as it continues to hug the top trend line while Russell is increasing its distance from it. This is minor stuff from which we should not draw immediate conclusions.
What is not minor stuff is what is happening to the indicators of both indices. Negative divergence has set in all of them and is most pronounced in the breadth oscillators (bottom). That is something which should get our attention because now, the indices cannot start pulling back without generating a sell signal which would be confirmed as soon as prices close below the small red horizontal lines drawn on the charts.
In the SPX, the red line represents a strong support level (1495) which has already been tested several times successfully. All the trading that has taken place above it is potential distribution and, if all the negative energy built into that pattern is fully expressed, it could mean that a fair amount of selling lies ahead. The word "potential" is the key. It is entirely possible that the index will choose to only honor one or two distribution phases within the pattern and not exercise the entire count -- which could take the SPX down over a hundred points! We should be on the alert for this possibility.
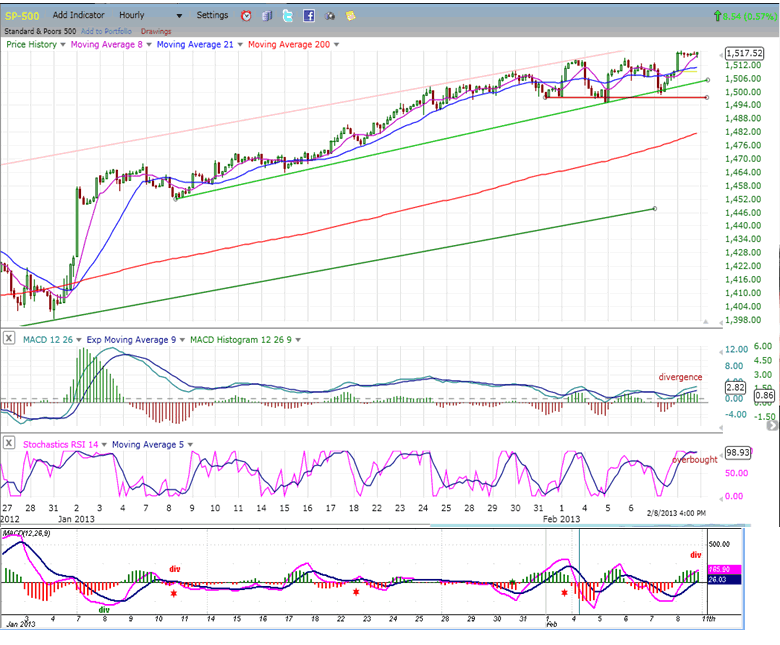
The hourly chart of SPX clearly shows that 1495 must be broken before we have a confirmed sell. The breaking of the green trend line would come first as a warning, especially since, by the time that happens, the price would already have broken below the two MAs.
The indicator shows how vulnerable we are to a reversal. With an overbought SRSI and diverging MACDs that are showing negative and beginning to roll over, it would take a very strong upward surge on Monday to nullify these warnings and delay the reversal process. Barring that, we could start declining and keep going. Markets don't go up forever without correcting and this one has defied gravity long enough!
Cycles
The 66-wk cycle has continued to push prices higher, but with less and less gusto, which means that declining cycles are trying to assume control of the trend.
There is a cluster of minor cycles bottoming sometime between 2/12 and 2/22 which could start the reversal process. We would then have to see if the rally resumes, or if we simply bounce before continuing the decline into the lows of more substantial cycles making their lows in late March/early April.
While cycles can provide a map for what lies ahead, they must always be confirmed by more reliable indicators.
Breadth
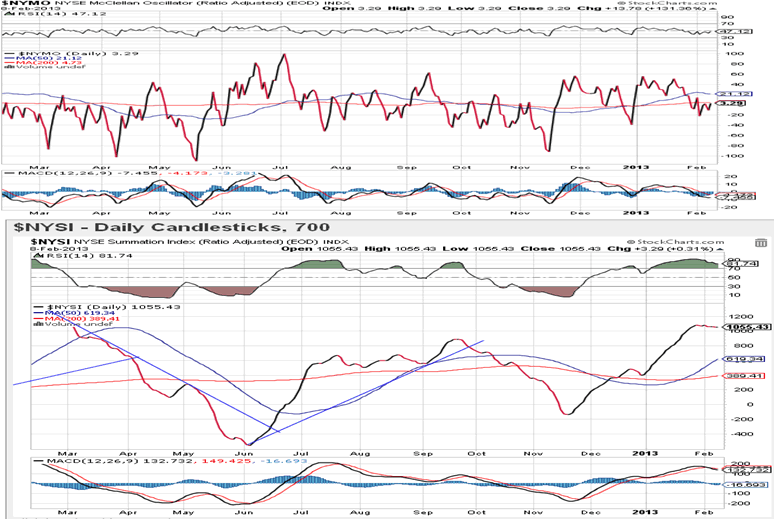
The McClellan Oscillator and Summation Index (courtesy of StockCharts.com) are posted below.
Similarly to the breadth indicator shown in the daily charts above, the McClellan oscillator has continued to weaken as the market moved higher. This is a sure sign of less and less participation by buyers resulting in a weakening uptrend which is ripe for a reversal.
After pulling back, the NYMO has settled around neutral and this has had the effect of flattening the NYSI and starting a correction in its RSI. As soon as NYMO turns negative, the Summation Index should start down and continue to decline until the correction is over.
Sentiment Indicators
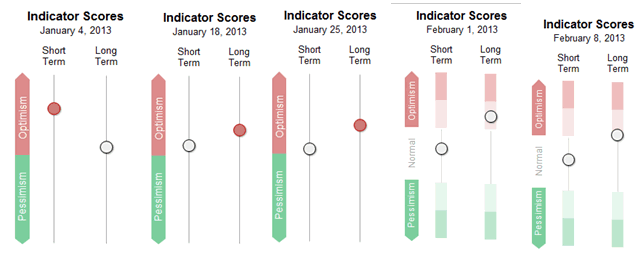
Last week's reading of The SentimenTrader (courtesy of same) shows that sentiment has actually become a little less bullish. It is not a statistically great enough change and we'll just ignore it for now.
VIX
VIX made its low on 1/24 and has retested it several times since, each time making a higher low. This is creating increasing positive divergence with the SPX, bringing closer and closer the reversal date of the latter (providing VIX does not make a new low). This action has caused the VIX P&F chart to form a base which has the potential of sending it to about 18.00/18.50. Should this move take place, it will send the SPX proportionally in the opposite direction.
XLF (Financial SPDR)
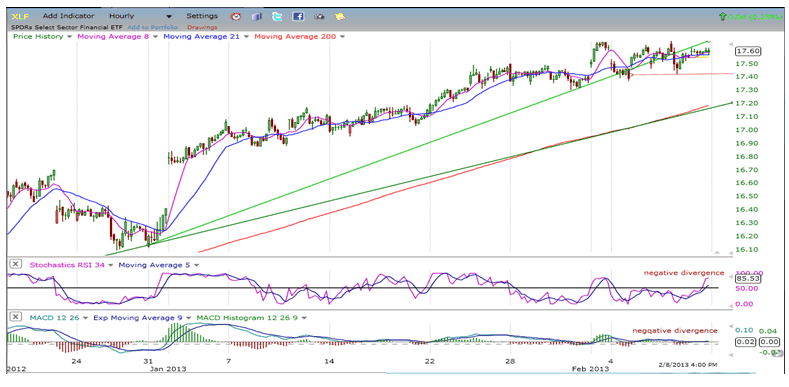
XLF and the DOW Industrials both attempted to make a new high last week and, although they succeeded intra-day by a fraction, they were not able to sustain the gain and reversed immediately. On Friday, they both remained shy of that high while SPX moved several points higher.
This is a notable change of behavior for both of these indices which have pretty much led the SPX higher for the past several weeks. This negative behavior - if it prevails -- adds to the various indicators also issuing red flags. This rally has been essentially staight up for many weeks but, since the beginning of the month, it has shown some obvious signs of decelaration.
The XLF indicators reflect this loss of upside momentum, especially the MACD which has flattened out just above the zero line.
BONDS
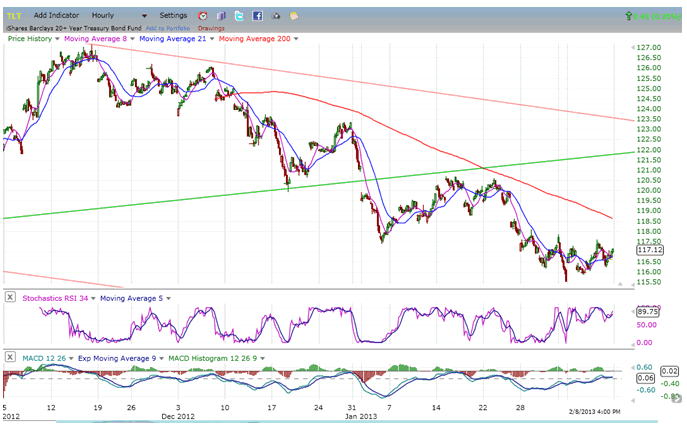
TLT appears to have reached a phase count which should put a short-term low in place, at least temporarily. A rally of a few points is expected, but it is unlikely that the index is ready to resume its long-term uptrend. In order to do so, it would have to move back above 126, something which does not seem likely at this time. At best, the index may start a weak rally of limited potential. At worst, the decline from 132 is the beginning of a long-term downtrend which is likely to resume as soon as the counter-trend rally (which is about to begin) has exhausted itself.
GLD (ETF for gold)
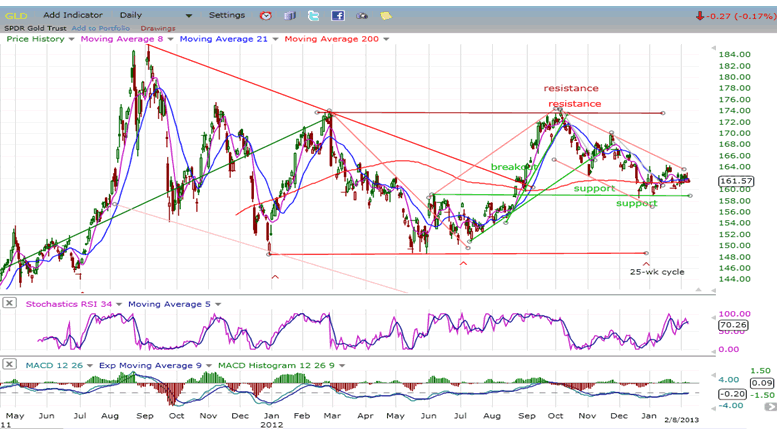
GLD is in a long-term corrective pattern which started after it met its 185 projection. Within the larger correction, the index is also in a short-term downtrend which found support at the designated 159 target, but the lack of sufficient buying appearing at that level suggests that its short-term correction may not be over and that a move down to 157 is likely. It is also possible that the decline will not stop there. There is enough distribution at the 167-168 level to send the index down to 150. However, GLD will have to prove that it is capable of that much weakness, especially since the 25-wk cycle is still up and should provide some resistance to the downtrend.
UUP (Dollar ETF)
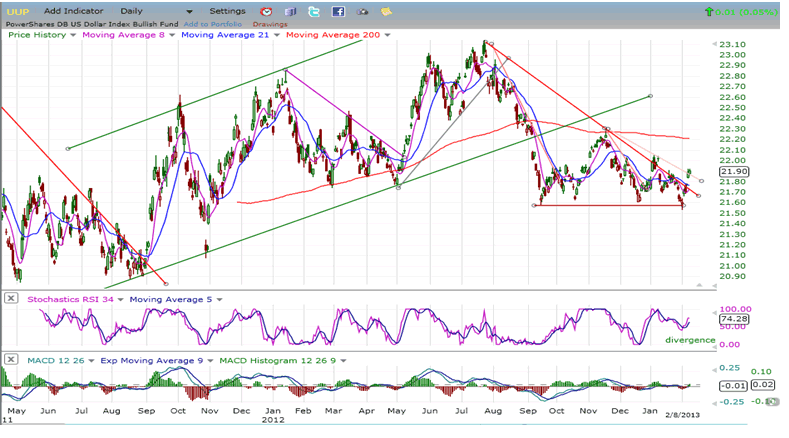
Assisted by a recent decline in the Euro, UUP has held its important 160 support level. It will have to do better than it has, so far, to prove that it is not making a bearish descending triangle pattern. If it wants to get back in an uptrend, it will have to rise above its 200-DMA which currently is at 22.20.
USO (United States Oil Fund)
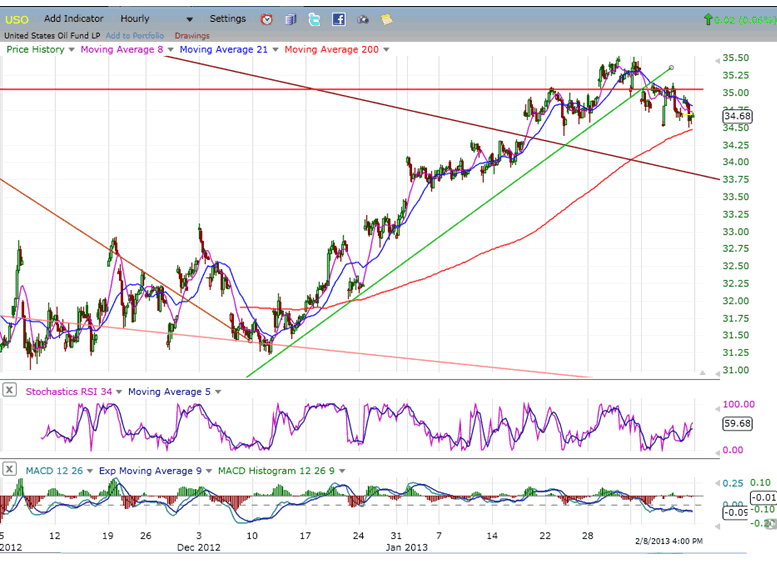
In the past few newsletters, I have suggested that USO was beginning to struggle with overhead resistance and was losing upside momentum. It is now being pushed back and has started to correct, finding temporary support on its 200-hr MA. If that does not hold, a back-test of the broken downtrend line would be in order. Dropping below that trend line once again could be a sign that the long-term weakness is reasserting itself.
For now, the index remains in a short-term uptrend and is only undergoing a well-deserved correction after a short-term rally. There is no top distribution yet, so the odds of an extensive pull-back right away are small. But it is still well-contained in a bearish long-term pattern and a lot of work will be required to reverse that trend.
Summary
"...(the) P&F pattern also carries the potential for 1522, so we must wait to see if a pull-back starts from this level or if it waits for the higher target to be reached."
On Friday, SPX reached a new high of 1518.31 and could still move a couple of points higher to complete its rally from 1398 (and perhaps from 1343). In either case, a correction is expected, with a more important one taking place if the move from 1343 is over.
The timing for the reversal could well be the President's State of the Union Address on Tuesday.
FREE TRIAL SUBSCRIPTON
If precision in market timing for all time framesis something that you find important, you should
Consider taking a trial subscription to my service. It is free, and you will have four weeks to evaluate its worth. It embodies many years of research with the eventual goal of understanding as perfectly as possible how the market functions. I believe that I have achieved this goal.
For a FREE 4-week trial, Send an email to: ajg@cybertrails.com
For further subscription options, payment plans, and for important general information, I encourage
you to visit my website at www.marketurningpoints.com. It contains summaries of my background, my
investment and trading strategies, and my unique method of intra-day communication with
subscribers. I have also started an archive of former newsletters so that you can not only evaluate past performance, but also be aware of the increasing accuracy of forecasts.
Disclaimer - The above comments about the financial markets are based purely on what I consider to be sound technical analysis principles uncompromised by fundamental considerations. They represent my own opinion and are not meant to be construed as trading or investment advice, but are offered as an analytical point of view which might be of interest to those who follow stock market cycles and technical analysis.
Andre Gratian Archive |
© 2005-2022 http://www.MarketOracle.co.uk - The Market Oracle is a FREE Daily Financial Markets Analysis & Forecasting online publication.


