


Gold Stocks vs the Stock Markets..Caution...
Stock-Markets / Stock Markets 2013 Feb 13, 2013 - 05:16 PM GMT

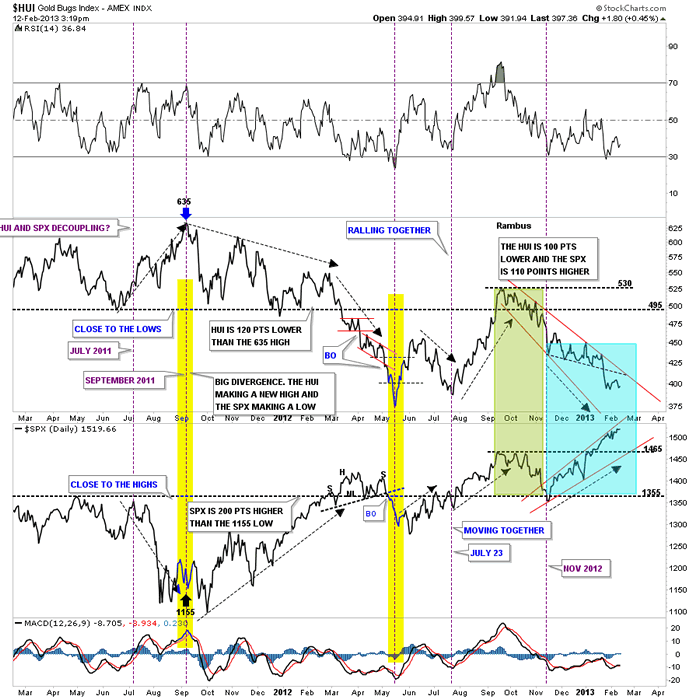
 I like to use this chart when I want to know how the HUI is doing compared the the stock markets. It clearly shows that sometimes the HUI is outperforming the SPX in a big way and sometimes the SPX is outperforming the HUI, yellow shaded areas, and sometimes they move together. I would like to focus your attention to the right side of the chart that shows the blue shaded area. The blue shaded area shows how the HUI and the SPX has decoupled starting in November of 2012. How long this divergence goes on is anybodies guess. But it is what it is until it changes.
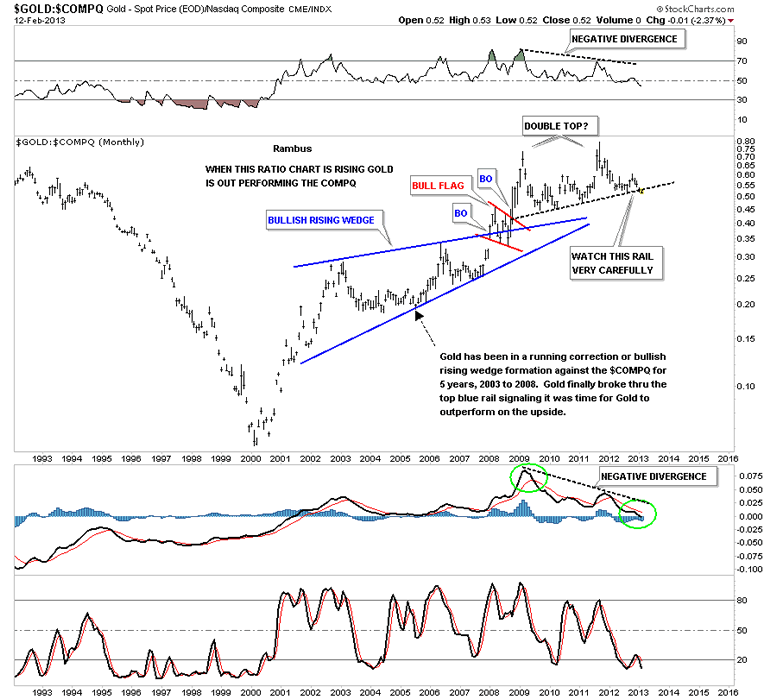
Lets look at a couple of ratio chart that shows something may be brewing when we compare gold to the COMPQ or the SPX. First lets look at the Gold to COMPQ ratio that is showing that the COMPQ has been outperforming gold for over a year now. There is a potential unbalanced double top in place where the double top trendline is being tested right here and now. You can see gold strongly outperformed the COMPQ during the first 9 years or so before the ratio put in it’s first peak in 2009. It formed a second peak that was slightly higher than the first peak but there was a very large negative divergence on the RSI and MACD indicators. Is this chart now suggesting that it might be time for the stock markets to start outperforming gold in a big way if the double top comes to fruition?
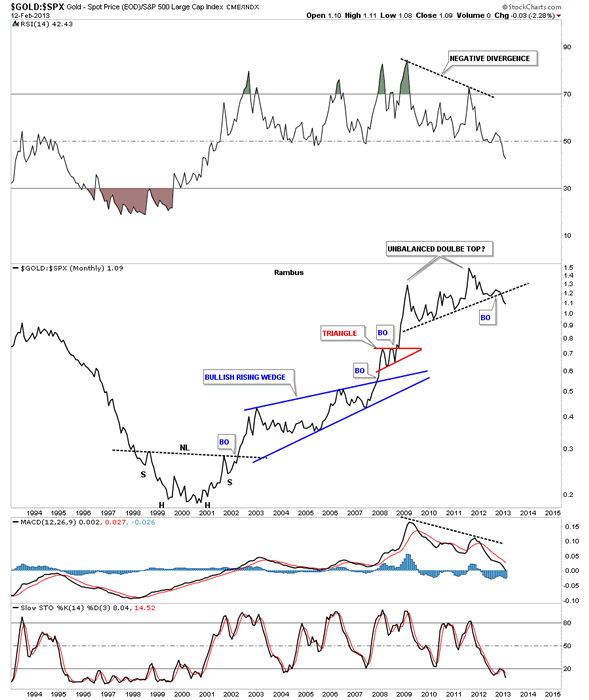
Lets look at the gold to SPX ratio chart that is showing a very similar pattern to the ratio chart above. Here I’m using a line chart that shows the ratio is breaking down from the unbalanced double top. You can see the beautiful inverse H&S bottom that was made back in late 1990′s and early 2000′s that launched the outperformance of gold to the stock markets. Keep in mind a big base leads to a big bull market and a big top leads to a big bear market which this ratio chart clearly shows. Also note the big negative divergences on the RSI and the MACD indicators. The question that has to be asked is the bull market that gold has enjoyed since 2000 compared to the stock markets coming to an end? Stay tuned as things are starting to get interesting.
LIMITED TIME FREE TRIAL - http://rambus1.com/?page_id=10
Rambus Chartology is Primarily a Goldbug TA Site where you can watch Rambus follow the markets on a daily basis and learn a great deal of Hands on Chartology from Rambus Tutorials and Question and Answers.
Most Members are Staunch Goldbugs who have seen Rambus in action from the 2007 to 2008 period at www.goldtent.org and now Here at Rambus Chartology since early 2012.
To review his Work and incredible calls from the 2007-2008 period click on the top right sidebar in the "Wizard of Rambus” ..."What If !!" Post
To Follow Rambus Unique Unbiased Chart Work and participate in a Chartology Form with questions and answeres and learn the Art and Science and Mindset of a Pro Trader please Join us by subscribing monthly for $29.99 at www.rambus1.com
© 2013 Copyright Rambus_Chartology
- All Rights Reserved
Disclaimer: The above is a matter of opinion provided for general information purposes only and is not intended as investment advice. Information and analysis above are derived from sources and utilising methods believed to be reliable, but we cannot accept responsibility for any losses you may incur as a result of this analysis. Individuals should consult with their personal financial advisors.
© 2005-2022 http://www.MarketOracle.co.uk - The Market Oracle is a FREE Daily Financial Markets Analysis & Forecasting online publication.