


Deflation Arrives In The Eurozone
Economics / Deflation Feb 16, 2013 - 12:03 PM GMTBy: Raul_I_Meijer

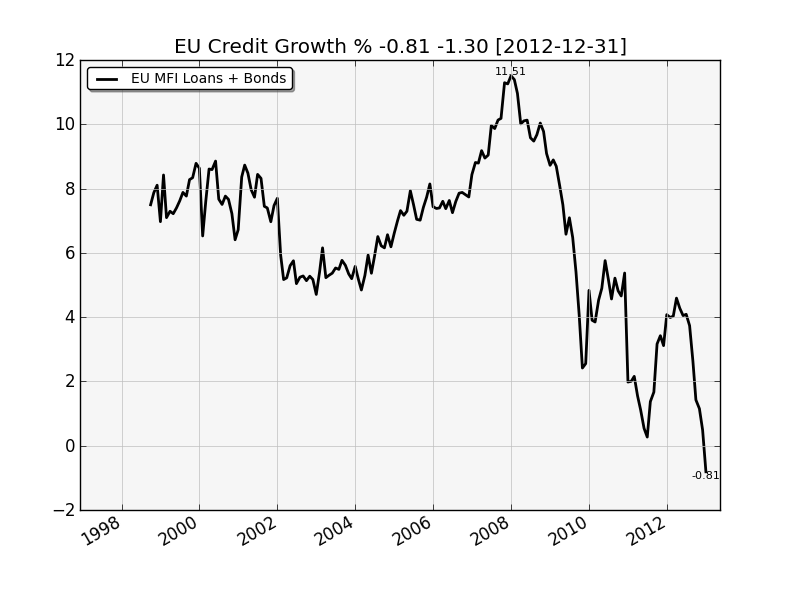
 Dave Fairtex: I've recently been exploring the statistical data warehouse provided by the ECB, and I was able to assemble the following chart, comprising MFI Loans (MFI = monetary financial institution) + Bonds (sovereign & corporate). It was good timing, because it shows that for the first time during this whole crisis, the eurozone has dropped into deflation.
Now don't get me wrong, if the Spanish banks (among others) had been marking their loans to market, deflation would have arrived long ago, but according to the data series provided by the ECB, Official Europe has now recognized that they are in deflation.
However you slice it, deflation is NOT a good sign for the equity markets. Fewer bank loans means less money to buy stuff. I'm ... perhaps not calling a top (that was back in 2007) but I am leaning short here, at least in the eurozone and especially Spain. Fun exercise: the Spanish credit growth during the bubble years was a good 20% per year growth for 4 years. That's twice what the US did during that same period. If you look at Ireland, it's even worse.
Here are the charts.
First - the growth (year/over/year) in credit in the eurozone. When the line goes below zero, that says credit is contracting year-over-year.
Eurozone Credit Growth
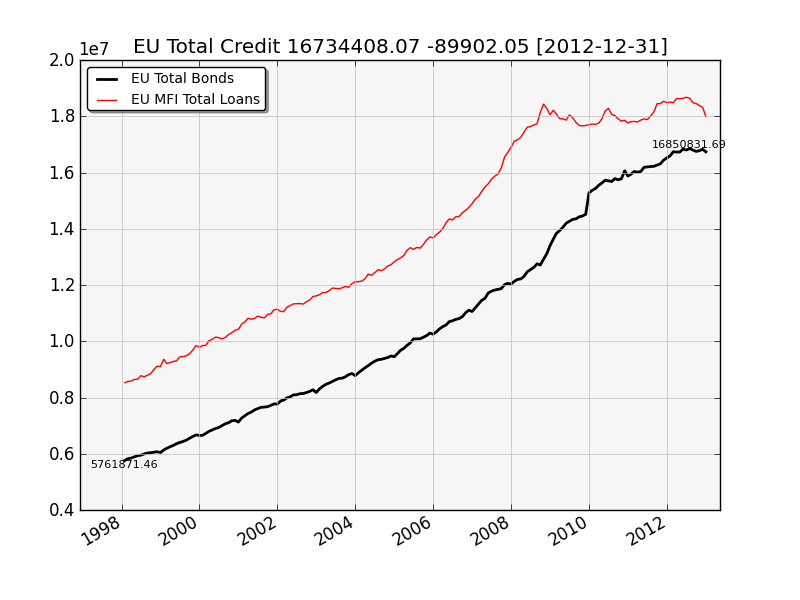
Next, the overall credit - bank loans and bonds. You can see bank loans have taken a bit of a spill recently.
Eurozone Total Credit
The table below describes the state of credit among the countries of the eurozone. The columns marked with time periods (3M, 1Y, 3Y, etc) are the annualized credit growth (or decline) over that time period. The "State" column says a nation is in deflation if the 1Y annualized credit growth in credit is negative - the column marked 1Y.
Note that Greece has already gone through a default and thus their credit decline is quite dramatic. The 10Y column is the average credit growth over the past 10 years, which is meant to give a sense of what "normal" credit growth looks like, although one might argue that the last 10 years may have been a bubble period in many nations.
One really important note: the data is collected by the ECB, and records the values of the loans and bonds as reported by that nation's banking system. If the banks in that nation have not yet written down their bad loans it is almost guaranteed that there is a substantial amount of deflation yet to occur. If you examine Ireland, you will see that the banks there have written down a large amount of their nonperforming loan portfolios. This is not true for most of the other nations in the eurozone.
Guest Post
By Raul Ilargi Meijer
Website: http://theautomaticearth.com (provides unique analysis of economics, finance, politics and social dynamics in the context of Complexity Theory)
© 2013 Copyright Raul I Meijer - All Rights Reserved Disclaimer: The above is a matter of opinion provided for general information purposes only and is not intended as investment advice. Information and analysis above are derived from sources and utilising methods believed to be reliable, but we cannot accept responsibility for any losses you may incur as a result of this analysis. Individuals should consult with their personal financial advisors.
Raul Ilargi Meijer Archive |
© 2005-2022 http://www.MarketOracle.co.uk - The Market Oracle is a FREE Daily Financial Markets Analysis & Forecasting online publication.