


U.S. Stock Markets Uptrend Continues
Stock-Markets / Stock Markets 2013 Feb 18, 2013 - 03:52 PM GMTBy: Tony_Caldaro

 While the US equity market made new uptrend highs this week, it did not do much to excite bulls nor bears. The entire range for the week was SPX 1514-1525. For the week the SPX/DOW were mixed, and the NDX/NAZ were -0.25%. On the international front. Asia gained 0.8%, Europe gained 0.3%, and the DJ World index was -0.1%. Economic reports continue to come in on positive. On the uptick: retail sales, export/import prices, business inventories, the NY FED, capacity utilization, consumer sentiment, investor sentiment, plus the budget deficit turned surplus, and weekly jobless claims improved. On the downtick: industrial production, the WLEI and the M1 – multiplier. Next week we get reports on housing, leading indicators and the FOMC minutes. Best to your week!
LONG TERM: bull market
Reviewing our weekly chart. The bull market continues to unfold as expected. The MACD is remaining predominently above neutral, as it does during bull markets. Plus, the RSI is spending more time getting extremely overbought, than it does when it gets only slightly oversold. Another bullish chartacteristic.
The wave count continues to suggest a Cycle wave [1] bull market is underway. These types of bull markets consist of five Primary waves. Primary waves I and II have already completed at SPX 1371 and SPX 1075 in 2011, and Primary wave III has been underway since that low. Primary I divided into five Major waves with a subdividing Major wave 1. Primary III is dividing into five Major waves as well, but both Major waves 1 and 3 have been subdividing.
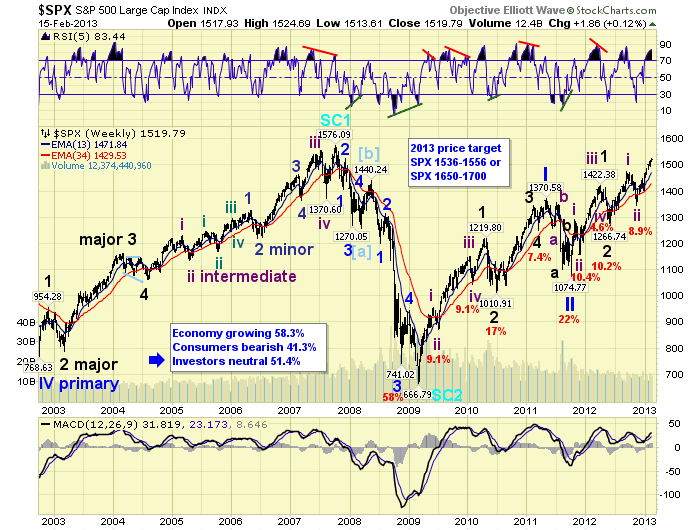
Major waves 1 and 2 completed at SPX 1422 and SPX 1267 in 2012, and Major wave 3 has been underway since that low. Currently the market is rising in Intermediate wave iii. Having completed Int. waves i and ii at SPX 1475 and SPX 1343. When this uptrend ends, Int. wave iii, an Int. wave iv correction should follow. Then another uptrend will complete Int. v and Major wave 3. Then after a Major wave 4 correction, a Major wave 5 uptrend should complete Primary III. Finally after a Primary IV correction, a minimum of another uptrend will be required to complete Primary wave V. This should all occur by the end of 2013.
MEDIUM TERM: uptrend
The market has been uptrending since the November low at SPX 1343. This uptrend has been dividing into five Minor waves, with each rising Minor wave subdividing into the Minute waves. Minor wave 1 rose in five Minute waves to SPX 1424. Then the market experienced and irregular Minor wave 2 flat during the fiscal cliff drama in Washington: 1398-1448-1398. After that Minor wave 3 was underway. Currently it still appears Minute waves i and ii completed at SPX 1468 and SPX 1452. Then Minute waves iii and iv completed at SPX 1515 and SPX 1498. Minute wave v has been underway since that low.
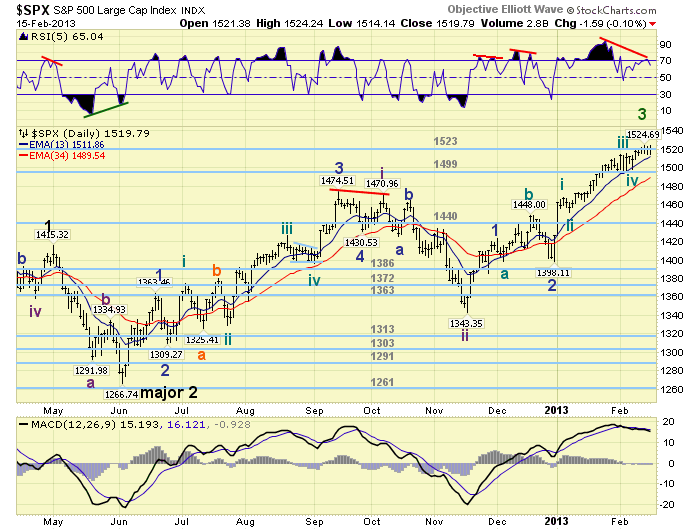
We reviewed the charts to see if we could determine the last time the market grinded its way to higher highs. Like it has been doing recently. And, what we found is not all that surprising. During Minor wave 3 of Intermediate wave iii, (which is exactly where we are now), of Major wave 1, the market continued to grind higher near the end of its rally. Minor wave 3, at that time, rose from SPX 1202 to 1378 and took two months. Then there was a quick Minor 4, which took only 4 trading days, and then the market rallied in Minor 5 to complete Int. wave iii. Currently this Minor 3 has rallied from SPX 1398-1525 and has been rising since December: two months. Minor wave 4 can clearly occur at any time. Medium term support is at the 1499 and 1440 pivots, with resistance at the 1523 and 1552 pivots.
SHORT TERM
Short term support is at the 1499 pivot and SPX 1471/75, with resistance at the 1523 and 1552 pivots. Short term momentum ended the week around neutral. The short term OEW charts are positive with the reversal level now at SPX 1516.
We did quite well in tracking this Minor wave 3 rally until it hit SPX 1510. Then the market got quite choppy for a while before hitting SPX 1498 and starting this slow grind higher. The problem, as we uncovered soon after SPX 1510, was that Minute wave iii had subdivided down to the Pico wave level. Three levels below Minute waves. As a result we maintained our Minute waves i and ii at SPX 1468 and 1452, but upped our Minute waves iii and iv to SPX 1515 and 1498.
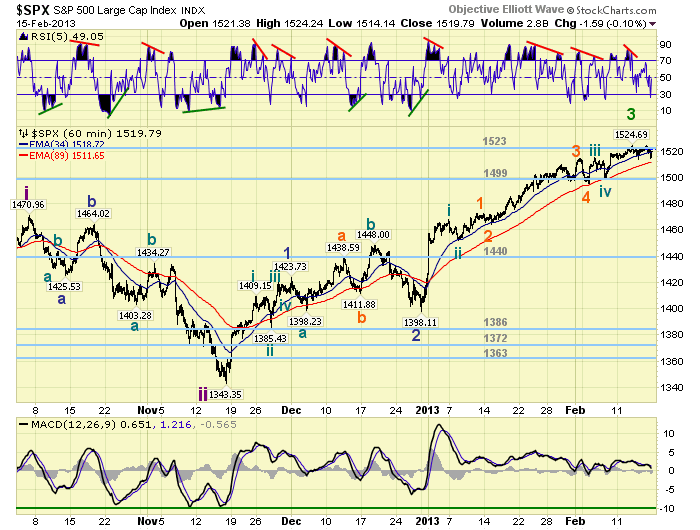
Minute wave v, while a bit boring, has been unfolding quite cleanly. From the SPX 1498 Minute iv low: we have one strong wave up to SPX 1525. Then a decline to 1514, a rally to 1524, and then another decline to 1514. On the bullish side this could be counted as Micro 1 to SPX 1525, then a Micro 2 flat to 1514, with Micro 3 underway now. Under a less bullish scenario this activity could be counted as a completion of Minute wave v and Minor 3 at SPX 1525. Then a pullback to SPX 1514, rally to 1524 on friday , and now lower lows ahead for Minor wave 4. To unravel these potential scenarios the market will need to either breakout above SPX 1525 or breakdown below 1514. Whichever comes first is the likely the correct scenario.
We still feel Minor wave 3 has reached our targeted OEW 1523 pivot range and can pullback for Minor 4 at anytime. The pullback, when it does occur should be between 30 and 40 points, and then a rally to the OEW 1552 pivot range should complete the uptrend. Should the market breakout above 1525, and clear the upper 1523 pivot range, (1516-1530), then the OEW 1552 pivot range would likely be next. Either way, we’re in an uptrend, in a bull market, and we are generally expecting higher prices before any sizeable correction. Best to your trading!
FOREIGN MARKETS
The Asian markets were mostly higher on the week for a net gain of 0.8%. India and S. Korea are in confirmed downtrends.
The European markets were mixed for a net gain of 0.3%. France, Germany, Spain and the Stox are in confrimed downtrends, with Italy weakening.
The Commodity equity group were all lower on the week for a net loss of 0.9%. Brazil is in a confirmed downtrend, with Canada weakening.
The uptrending DJ World index lost 0.1%.
COMMODITIES
Bonds continue to downtrend losing 0.2% on the week.
Crude remains in an uptrend and gained 0.5% on the week.
Gold started breaking lower about midweek taking the rest of the precious metals complex with it by week’s end. For the week Gold lost 3.4%.
The USD confirmed another uptrend this week gaining 0.4%, as it continues its choppy trading activity of the past several months.
NEXT WEEK
Monday is a holiday and the markets are closed. Tuesday kicks off the economic week with the NAHB housing index. Wednesday: Housing starts, Building permits, the PPI and FOMC minutes. Thursday: weekly Jobless claims, the CPI, Existing home sales, the Philly FED and Leading indicators. As for the FED they will be active on friday, with a panel discussion with FED governor Powell at 10:15, then a speech from FED govenor Tarullo after hours. Best to your three day weekend and week!
CHARTS: http://stockcharts.com/...
http://caldaroew.spaces.live.com
After about 40 years of investing in the markets one learns that the markets are constantly changing, not only in price, but in what drives the markets. In the 1960s, the Nifty Fifty were the leaders of the stock market. In the 1970s, stock selection using Technical Analysis was important, as the market stayed with a trading range for the entire decade. In the 1980s, the market finally broke out of it doldrums, as the DOW broke through 1100 in 1982, and launched the greatest bull market on record.
Sharing is an important aspect of a life. Over 100 people have joined our group, from all walks of life, covering twenty three countries across the globe. It's been the most fun I have ever had in the market. Sharing uncommon knowledge, with investors. In hope of aiding them in finding their financial independence.
Copyright © 2013 Tony Caldaro - All Rights Reserved Disclaimer: The above is a matter of opinion provided for general information purposes only and is not intended as investment advice. Information and analysis above are derived from sources and utilising methods believed to be reliable, but we cannot accept responsibility for any losses you may incur as a result of this analysis. Individuals should consult with their personal financial advisors.
Tony Caldaro Archive |
© 2005-2022 http://www.MarketOracle.co.uk - The Market Oracle is a FREE Daily Financial Markets Analysis & Forecasting online publication.