


The Most Important Chart for Oil Investors to See
Commodities / Crude Oil Feb 20, 2013 - 06:35 PM GMTBy: GrowthStockWire

 Matt Badiali writes: Each new number out of the oil sector is bigger than the last...
As longtime readers know, we're in the middle of an energy revolution. The technology is advancing so quickly, it's like moving from the Model T to the Ferrari in just a few years.
And it's helping the U.S. tap incredible reserves of oil and natural gas. The latest forecasts are out... and they're shocking.
If you own energy stocks, you have to see this chart...
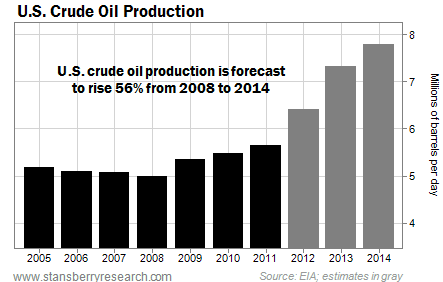
According to the U.S. Energy Information Administration (EIA), domestic crude oil production will hit 7.8 million barrels per day by 2014. That's the highest production since 1988. It represents an astonishing 56% increase from the recent low of 5 million barrels per day in 2008.
This chart below shows exactly what I'm talking about...
To put that in perspective, the increase alone will be enough to supply all of Russia's oil demand. It's nearly enough oil to supply the entire continent of Africa. In fact, it's more than enough oil to supply any country in the world except the U.S., China, India, and Japan.
What does this mean for investors?
Get cautious. As domestic production increases, the U.S. requires fewer imports. (Oil imports are already at their lowest point since 1998... and falling.) That removes a huge chunk of demand from the global market. Prices will drop dramatically. The EIA is forecasting an 8% decline in the global oil price and a 15% decline in 2014.
If you own high-cost producers – companies that have to spend a lot of money to pump a barrel of oil – you should cut them loose. Take Suncor (NYSE: SU), for example. Suncor is the "poster child" of Canada's oil sands. These energy deposits are tough to mine.
According to Bloomberg, it cost Suncor $139.94 to produce one barrel of oil in 2011 (the most recent data available). Compare that to ExxonMobil (NYSE: XOM) – the world's best oil company – which spent just $9.44 a barrel on average.
When you have to spend a lot of money to produce oil, you make a lot less selling it. Suncor's profit margin was just 7.3% in 2012, even with high domestic oil prices. This company could begin to lose money if oil prices fall even slightly. Many other oil producers are in the same situation.
If you own any high-cost producers, take some money off the table and protect yourself. The oil production numbers we're seeing today are extraordinary... and they're just going to get bigger.
Good investing,
Matt Badiali
http://www.growthstockwire.com
The Growth Stock Wire is a free daily e-letter that provides readers with a pre-market briefing on the most profitable opportunities in the global stock, currency, and commodity markets. Written by veteran trader Jeff Clark, and featuring expert guest commentaries, Growth Stock Wire is delivered to your inbox each weekday morning before the markets open.
Customer Service: 1-888-261-2693 – Copyright 2009 Stansberry & Associates Investment Research. All Rights Reserved. Protected by copyright laws of the United States and international treaties. This e-letter may only be used pursuant to the subscription agreement and any reproduction, copying, or redistribution (electronic or otherwise, including on the world wide web), in whole or in part, is strictly prohibited without the express written permission of Stansberry & Associates Investment Research, LLC. 1217 Saint Paul Street, Baltimore MD 21202
Disclaimer: The above is a matter of opinion provided for general information purposes only and is not intended as investment advice. Information and analysis above are derived from sources and utilising methods believed to be reliable, but we cannot accept responsibility for any losses you may incur as a result of this analysis. Individuals should consult with their personal financial advisors.
Growth Stock Wire Archive |
© 2005-2022 http://www.MarketOracle.co.uk - The Market Oracle is a FREE Daily Financial Markets Analysis & Forecasting online publication.