


Dollar and Bonds, Why Deflation Wins!
Stock-Markets / Deflation Mar 05, 2013 - 05:48 PM GMT

 Yesterday I discussed the possibility that the US economy has slipped into a deflationary morass and I seemed to have touched a nerve. As a result I want to continue discussing the idea that deflation, not inflation, now has the upper hand in the US economy. We all know that the Fed has been easing since 2009, and it recently raised the bar to include US $85 billion/month in bond purchases. As a result the Fed balance sheet is now filled with US $3.078 trillion in assets of dubious quality. I maintain that little or none of that liquidity has filtered out into the real economy, you and I, and as proof I told you to look at this chart of the Velocity of Money:
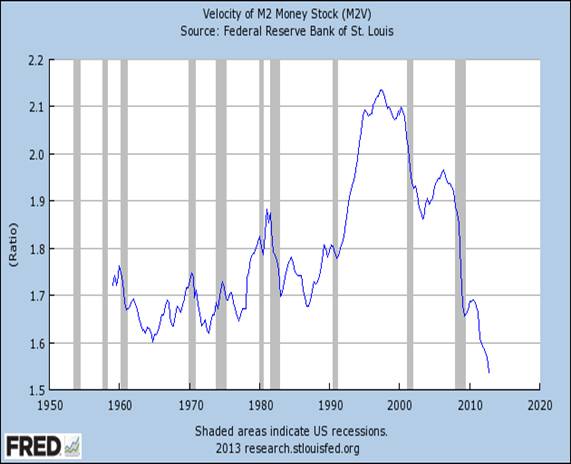
After a brief resurgence in late 2011 and early 2012 it turned down and is now falling almost straight down. This is a very disconcerting chart and yet you’ll almost never see it mentioned in the mainstream media. The velocity of money has never been this low and that has a lot to do with the stagnation we see in the economy.
Yet the inflationist continues to look at the creation of money and insists that inflation is the only possible outcome. Yesterday I was perusing a popular website, www.jsmineset.com, and I ran across the following comment:
“Debt is the very essence of fiat. As debt defaults, fiat is destroyed. This is where all these deflationist get their WRONG direction. Not seeing that hyperinflation is the process of saving debt at all costs, even buying it outright for cash. Deflation is impossible in today’s dollar terms because policy will allow the printing of cash, if necessary, to cover every last bit of debt and dumping it on your front lawn! Worthless dollars, of course, but no deflation in dollar terms!”
The idea might not be fallacious, but I contend that it does not fit what is going on in today’s world and I want to explain why.
I want you to think of debt as an iceberg. The exposed portion, the tip, sticks out above the surface of the water and comprises a very small percentage of the entire body. For our purpose the tip of the iceberg is what is known as “national debt” and totals US $16.662 trillion as of 8 am EST today, and it increases by one million dollars every thirty-three seconds! When the Fed eases, it eases in the hopes of alleviating the pressure put on the economy by the massive national debt. Right now the Fed is creating US $85 billion a month while the national debt is increasing by US $1.1 trillion a year. This means that under the best of circumstances the Fed is running in place, treading water, or whatever other metaphor you’d like to use.
So the Fed is barely keeping even with servicing the tip of the iceberg. In fact I have been telling investors for five years that the Fed has committed a serious if not fatal error by reacting after the fact instead of acting before the problem blows up in your face. Once again I want to remind you that we are just talking about the tip, and the real problems lay well below the surface. Below the tip we have a mountain of debt euphemistically referred to as “unfunded obligations.” These are things like all the money owed to the Social Security Trust Fund, Medicare, Medicaid, and so on… Depending on whom you listen to this amounts to a minimum of US $80 trillion and could even exceed US $150 trillion. Although this sounds like a lot of money, this only comprises about 20% of the iceberg.
The Fed’s panacea of quantitative easing is not directed toward these unfunded obligations because they are under the surface and out of everybody’s radar. The Fed’s only course of action so far has been to tell Congress to deal with it. Congress does what it does best and that is nothing. To make matters worse the unfunded obligations are growing at no less than 5% a year, or a minimum of US $4 trillion. So between national debt and unfunded obligations, total debt is increasing by no less than five trillion dollars and comprises no more than 25% of our iceberg. Now you can see that the Fed’s contribution of US $85 billion pales in comparison to what is needed, and you can begin to understand why the velocity of money is sloped downward like a rabbit headed down a deep hole.
Still we are only dealing with 25% of the iceberg. The real meat of the issue deals with something called over-the-counter derivatives. According to the Bank of International Settlements the amount of OTC derivatives totaled US $640 trillion as of June 2012. I have seen other estimates that that almost double this amount, but even using lower figures it comprises 75% of our iceberg. Most of these are interest sensitive and are almost always denominated in US dollars. With the increase in interest rates over the last nine months you can rest assured that some stress exists. Because they are OTC they are unregulated and there is no way to know if either party actually has the money to back up its obligation. Since the world economy is valued at US $80 trillion, it’s a safe bet that they don’t. Finally, assuming a 1% growth rate that tacks on another US $7.5 trillion a year in new debt.
So now you can begin to grasp the problem in its entirety. The Fed is merely trying to keep the cork in the bottle and it’s losing the battle to the tune of US $11.5 trillion a year versus the US $1 trillion flowing out from its printing press. As I see it the debt will begin to increase exponentially within a year or so. Additionally, a side affect of so few dollars chasing so much debt is upward pressure on the US dollar and through what was strong resistance at 81.45 as you can see here:
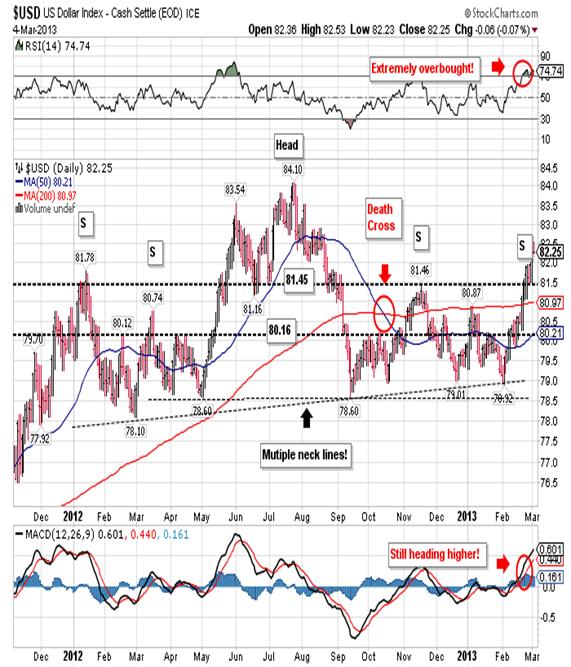
This upward pressure is going to continue over the short run and I would not be surprised to see the dollar reach resistance at 84.89 before finally turning down.
In fact if you think about it long enough you can also understand why interest rates have been on the rise as shown in this chart:
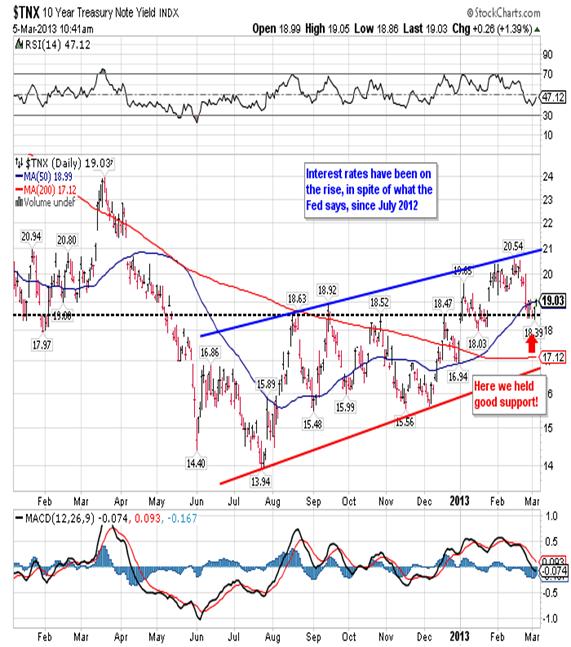
It’s a simple case of way too much debt chasing way too few dollars, so rates have to go up as a form of compensation.
In conclusion I don’t have any doubt that the dollar will fall and the bonds will become worthless, but I take exception to the idea that we’ll succumb to inflation. We’re now firmly mired in a deflationary morass and it will only get worse. Yesterday I demonstrated that copper and oil were suffering declines over time and if you look at other products like sugar, steel and aluminum to mention just a few, you’ll see the same downward pressure on prices. Why? Consumers are buying less and company inventories are beginning to swell. GM now has the largest inventory going back more than a decade. The Fed blew it and will not print what’s needed to generate the inflation we need until it’s too late. Deflation and debt are a horrible combination and that’s precisely what we’re going to get.
Robert M. Williams
St. Andrews Investments, LLC
Nevada, USA
Copyright © 2013 Robert M. Williams - All Rights Reserved
Disclaimer: The above is a matter of opinion provided for general information purposes only and is not intended as investment advice. Information and analysis above are derived from sources and utilising methods believed to be reliable, but we cannot accept responsibility for any losses you may incur as a result of this analysis. Individuals should consult with their personal financial advisors.
© 2005-2022 http://www.MarketOracle.co.uk - The Market Oracle is a FREE Daily Financial Markets Analysis & Forecasting online publication.