An Investor's Guide to X-treme Monetary and Fiscal Conditions
Stock-Markets / Financial Markets 2013 Mar 09, 2013 - 06:28 PM GMTBy: John_Mauldin
 I landed in Buenos Aires early this morning and have a day layover before heading off to Cafayate; but it is time to send you this weekend’s Outside the Box, and what a wonderful, powerful piece it is. I read John Hussman’s latest on the way down and had to review it several times. There is just so much meat here. And more than his usual quota of those wonderful graphs he comes up with. Did you know there is a 94% correlation between the price of beer in Iceland and the S&P 500? This is a teaching moment we must heed!
I will tease you with a few paragraphs:
Let’s be clear about what Bernanke is saying: “[A ‘deferred asset’] is an asset in the sense that it embodies a future economic benefit [to the Fed] that will be realized as a reduction of future cash outflows [to the public].
In effect, to the extent that the Fed experiences losses because it overpaid for Treasury securities that it bought from primary dealers (comprising the too-big-to-fail banks and Wall Street investment firms), the U.S. public will pay for those losses without any need for Congressional legislation. This doesn’t mean that the Fed will refrain from continued quantitative easing, but we should all understand how this policy works, and the risks and potential costs that it quietly imposes on the public.
And:
Another assertion that makes me wince is the idea that “since 2009, there has been an 85% correlation between the monetary base and the S&P 500.” This is a distressing use of statistics, because two data series will always have an extremely high correlation if both series capture an uncorrected diagonal move. For example, it is equally true that since 2009, there has been a 94% correlation between beer prices in Iceland and the S&P 500. That’s not to dismiss the enormous effect that Fed policy has had on the markets in recent years, but the implication of an “85% correlation” is that if one increases, the other is sure to increase as well. There is little basis in the data for that belief. The exception is that when stocks are down significantly from their level of 6-months prior, monetary easing is often eventually capable of boosting confidence and reversing recent spikes in risk premiums.”
Hussman also leads us through four economic policy choices and outlines the outcome for each choice. You can make your own decision about what your country is likely to do.
I will be with John in about a month (April 5) in Sonoma, where we will both speak at Mike Shedlock’s fundraising event. John is graciously matching your conference fee, and it all goes to ALS research. You can find out more at Mish’s Conference. And for the two people left out there who don’t know John Hussman, he runs the Hussman Funds and writes his brilliant commentary at www.hussmanfunds.com.
As I left last night the movers were packing up the last boxes to take to storage. My staff members Mary and Shannon have been supervising the move while I just keep working and every now and then agree to throw away more accumulated material (I won’t say junk!). I am going to take advantage of a perfect day here in BA and do a little touristy browsing. It has been years since I was in the cemetery here in the Recoleta, and it is just a block away. I fly out early tomorrow to Salta, meet up with my old friend Tony Sagami, and then drive up the magnificently scenic canyon to Cafayate.
I think we will somehow make it to Bill Bonner’s Estancia early next week, along with Doug Casey, David Galland, and Olivier Garret. It’s way back in the Andes on about 200,000 acres of god-forsaken high desert. I am told it is breathtaking and have been wanting to get there for a long time. It may turn into the longest time I have been without internet in a decade. We will see what the withdrawal symptoms are like. Though I have to confess, I do have close to a thousand pages of miscellaneous reading on my iPad, not to mention 20 books. I think I can cope.
Have a great week; I know I will.
Your letting it all soak in analyst,
John Mauldin, Editor
Outside the Box
JohnMauldin@2000wave.com
An Investor’s Guide to X-treme Monetary and Fiscal Conditions
By John P. Hussman, Ph.D
Government intervention in the U.S. economy is approaching the point where probable long-term costs exceed short-term benefits – straining to maintain the pace of extraordinary fiscal and monetary measures that have repeatedly nudged the U.S. economy from the border between new recession and tepid growth for three years. U.S. Treasury debt now exceeds 105% of GDP (publicly held debt approaching 75% of GDP). Meanwhile, the Federal Reserve has expanded the monetary base to more than 18% of GDP (18 cents per dollar of nominal GDP), where a century of U.S. economic history indicates that a normalization to Treasury bill yields of just 2% could not tolerate more than 9 cents of monetary base per dollar of GDP without inflation.
The federal government continues to run a deficit of about 7% of GDP, which the $85 billion sequester would reduce to about 6.5% under the unlikely assumption that economic activity and revenues don’t contract somewhat. Current Federal Reserve policy absorbs about $45 billion per month in new government debt as part of QEternity, but even the Fed continues this policy indefinitely, U.S. publicly held debt is still likely to expand by several percent annually assuming no recession occurs. Any eventual normalization of Fed policy would dump Treasuries back into public hands (or require public purchases of new debt in the event the Fed decides to let the holdings “roll off” as they mature). Massive policy responses, directed toward ineffective ends, are scarcely better than no policy response at all.
Let’s take a look at the current monetary and fiscal policy environment, and then examine more effective policy initiatives and why they make sense.
Monetary Policy – All In
To offer a visual picture of where monetary policy stands at present, the chart below depicts the current situation, as well as data points since 1929. As of last week, the U.S. monetary base stands at a record 18 cents per dollar of nominal GDP. The last time the monetary base reached even 17 cents per dollar of nominal GDP was in the early 1940’s. The Fed did not reverse this with subsequent restraint. Instead, consumer prices nearly doubled by 1952. At present, a normalization of short-term interest rates to even 2% could not be achieved without cutting the Fed’s balance sheet by more than half. Alternatively, the Fed could wait for nominal GDP to double and “catch up” to the present level of base money, which would take about 14 years, assuming 5% nominal GDP growth.
Of course, 5% nominal growth would likely make it inappropriate to hold short-term interest rates below 2% for another 14 years. So either the Fed will reverse its present course, or we will experience unacceptable inflation, or we will experience persistently weak growth like Japan has experienced since 1999, when it decided to take Bernanke’s advice to pursue quantitative easing. My guess is that we will experience unacceptable inflation, beginning in the back-half of this decade.
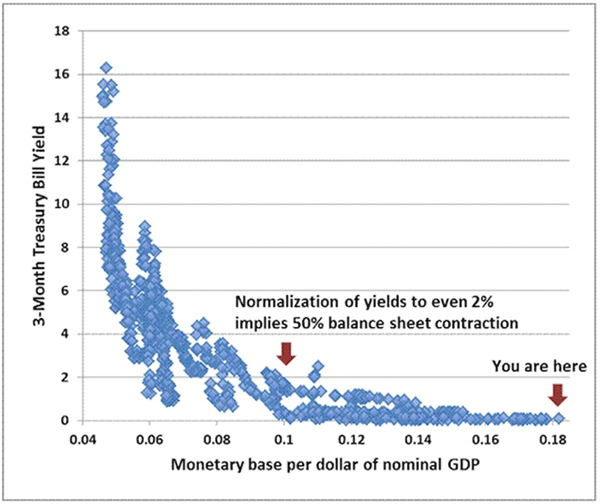
Because of the strong relationship between the size of the monetary base (per dollar of nominal GDP) and short-term interest rates, it appears likely that short-term interest rates will be suppressed by Fed policy for some time, until Fed policy normalizes or inflation accelerates. The Fed is now leveraged 55-to-1 against its own capital. With an estimated duration of about 8 years on $3 trillion of bond holdings, every 100 basis point move in long-term interest rates can be expected to alter the value of the Fed’s holdings by about $240 billion – roughly four times the amount of capital reported on the Fed’s consolidated balance sheet.
Accordingly, the Fed recently indicated that it will create a new line called a “deferred asset” on its balance sheet. This “deferred asset” is a phantom accounting entry that represents the anticipation of future interest on the Treasury securities held by the Fed. This interest will not be paid back to the Treasury for the benefit of the public, as the Fed has historically done. Instead, the interest will be retained by the Fed. As Bernanke indicated in his Congressional testimony last week, in language that seems almost intentionally designed to confuse: “It is an asset in the sense that it embodies a future economic benefit that will be realized as a reduction of future cash outflows.”
Let’s be clear about what Bernanke is saying: “It is an asset in the sense that it embodies a future economic benefit [to the Fed] that will be realized as a reduction of future cash outflows [to the public].”
In effect, to the extent that the Fed experiences losses because it overpaid for Treasury securities that it bought from primary dealers (comprising the too-big-to-fail banks and Wall Street investment firms), the U.S. public will pay for those losses without any need for Congressional legislation. This doesn’t mean that the Fed will refrain from continued quantitative easing, but we should all understand how this policy works, and the risks and potential costs that it quietly imposes on the public.
Ultimately, the normalization of the Fed’s balance sheet – outside of weak economic conditions – is likely to press long-term interest rates markedly higher. This would be particularly true in the event that inflation accelerates and forces that attempt to normalize, which we expect in the back-half of this decade. As a result, the next economic recovery will very likely be associated first with a significant steepening of the yield curve, and only later by an inversion as the Fed scrambles to tighten. But in my view, the time to expect higher interest rates is not now.
I continue to expect that the course to the next economic recovery is likely to be punctuated by a global recession that is already underway in the rest of the developed world. At best, U.S. participation in that downturn has been kicked down the road for a quarter or two by QEternity. It also remains possible the final revised data will indicate that the U.S. entered a recession sometime in the third-quarter of last year. Meanwhile, immediate inflation risks do not appear pressing (despite the increase in longer-term inflation expectations), and the overwhelming negative sentiment toward bonds seems likely to be replaced by a flight to Treasuries as a safe haven. The same should not be assumed for corporate or high-yield debt, where yields have plumbed historic lows and current risk premiums appear barely sufficient to cover actuarial default risks.
By varying the amount of monetary base relative to nominal GDP, the Fed has very tight control over short-term Treasury yields and some control over the long-term yields that reflect expectations of the future course of short-term rates. But quantitative easing has also had an effect in suppressing risk premiums in securities that have much less dependence on the course of short-term rates – particularly junk rated debt, corporate debt, and stocks. The apparent blind faith in an automatic link between Fed easing and diagonally rising prices is not supported by the data, however much an uncorrected rally makes it seem otherwise.
The present syndrome of overvalued, overbought, overbullish, rising-yield conditions is the same basic environment that concerned us in 2007, and in 2000 (as well as May 2011, just before the market experienced a near-20% swoon). While the Fed continues its policy of quantitative easing, that policy is fully recognized and investors now fully rely upon its continuation. It is also an element of common knowledge that “everything will be fine until the Fed reverses course,” at which point everybody will presumably be able to sell to nobody. Unfortunately, the support for such complete confidence in Fed policy is vastly overstated.
From an analytical perspective, it’s striking to me that even some thoughtful economists we know have been making assertions about Fed policy that have no basis in the data. For example, we heard last week that “The number of times we actually had a bear market on our hands with the Fed easing and the economy expanding by any amount is around zero.” Wow. That’s not even true in the “active Fed” period. Consider for example March-October 2002, when the market plunged 30% despite reductions in the Federal Funds rate and the discount rate, despite positive GDP growth – two quarters into an economic recovery, and despite a Purchasing Managers Index persistently above 50. Ditto for late-2007 when a bear market had already started, the Fed was already easing and the PMI was still above 50 (despite a recession that wouldn’t be recognized until several quarters later).
Another assertion that makes me wince is the idea that “since 2009, there has been an 85% correlation between the monetary base and the S&P 500.” This is a distressing use of statistics, because two data series will always have an extremely high correlation if both series capture an uncorrected diagonal move. For example, it is equally true that since 2009, there has been a 94% correlation between beer prices in Iceland and the S&P 500. That’s not to dismiss the enormous effect that Fed policy has had on the markets in recent years, but the implication of an “85% correlation” is that if one increases, the other is sure to increase as well. There is little basis in the data for that belief. The exception is that when stocks are down significantly from their level of 6-months prior, monetary easing is often eventually capable of boosting confidence and reversing recent spikes in risk premiums.
In case you’re wondering, since 2000 there has been only a 9% correlation between the monetary base and the S&P 500, but a 99% correlation between the monetary base and the price of beer in Iceland. Why? The S&P 500 has experienced massive up and down cycles, while the monetary base and beer prices have both trended higher over time.
Suffice it to say that in a century of historical data, the market has experienced terribly negative outcomes, on average, following the emergence of severely overvalued, overbought, overbullish, rising-yield conditions that we presently observe. These capture a rare set of historical instances including 1929, 1972, 1987, 2000, 2007 and early 2011 – what I often refer to as a “Who’s Who” of awful times to invest. Profoundly negative outcomes have exerted themselves even in the face of ongoing or subsequent easing by the Federal Reserve. Still, coordinated easing by the Fed and the European Central Bank was able to limit the 2011 instance to a decline of just under 20%, so we are very aware of the need for our approach be nimble. I expect that the two adaptations to our approach we’ve made in recent years will address tha t need.
Fiscal Policy – Why Deficit Reduction Requires Investment Stimulus
Last week, $85 billion in automatic government spending cuts became reality. It seems likely that a quick round of legislation will mute the more serious effects of these cuts on military spending, air traffic controllers, and other core government services that affect public safety and national security. Other alterations may be harder won on each side, and an extended battle is likely. Meanwhile, the current stopgap spending authorizations that are keeping the government running expire on March 27. The currently-suspended debt ceiling limit comes back into force on May 19. We have thus entered a period of significant budget uncertainty, at a point where economic conditions are borderline at best.
The following are a few notes regarding the appropriate way to pursue budget discipline. Rather than discuss a wish-list of desirable but politically contentious policies, what follows is the single component that I believe is essential to the current policy response.
Let’s begin with an overview of the fiscal situation. The present federal deficit is about 7% of GDP. More than half of the deficit is explained by the shortfall of actual GDP from “potential” GDP (as estimated by the Congressional Budget Office). The remainder reflects both revenues below historical the norm and spending above the historical norm, as a percentage of GDP. With gross federal debt over 105% of GDP, the resulting escalation of debt is likely to become problematic for the capital markets within a small number of years.
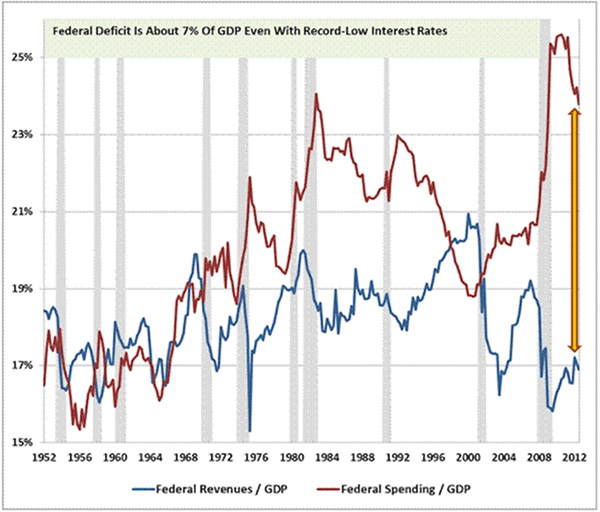
The federal deficit is considered to be an “automatic stabilizer” – it tends to widen during recessions, offsetting a portion of general economic weakness, and it tends to narrow during expansions. Given the significant continued weakness of the U.S. economy, a portion of the federal deficit is the natural, stabilizing outcome of higher spending and reduced revenues.
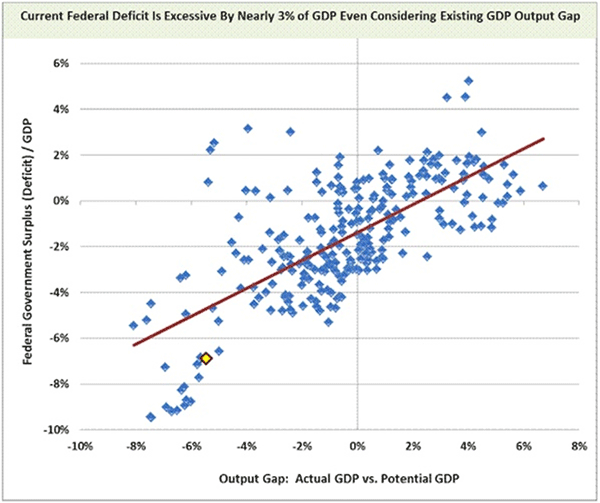
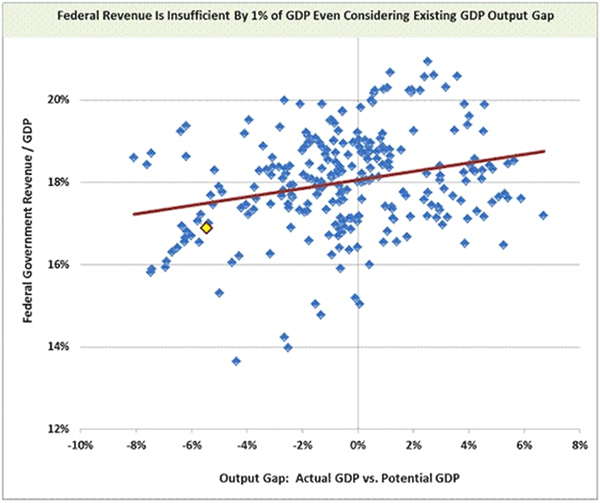
A good way to see this is to plot the government surplus (deficit) as a share of GDP against the “output gap” – the difference between actual GDP and potential GDP. In the chart below, a move to the upper right reflects a stronger economy and improved government finances. A move to the lower left reflects a weaker economy and a deeper deficit. Notably, even accounting for the considerable size of the existing output gap, the current Federal deficit exceeds historical norms by about 3% of GDP (the present data point is highlighted).
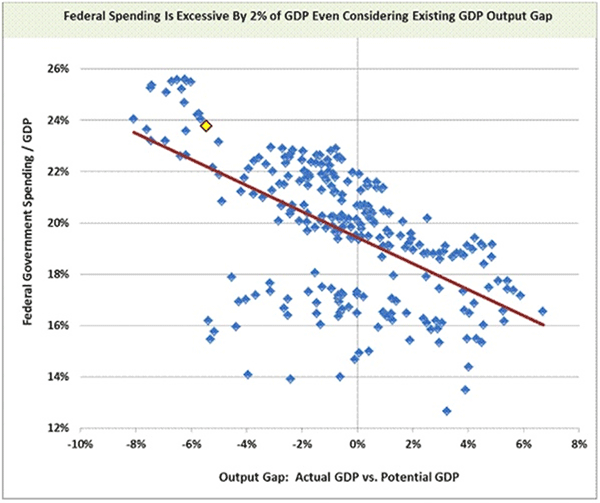
The present federal shortfall is driven both by excessive government spending, relative to historical norms, and insufficient revenue. A weak economy with a significantly negative output gap is usually associated with greater federal spending, as a result of unemployment programs and various stimulus measures. Presently, federal spending exceeds historical norms by about 2% of GDP, even considering the existing GDP output gap.
As the economy strengthens, federal revenues tend to improve. As the economy weakens, federal revenues tend to fall short. Federal revenue is presently insufficient, relative to historical norms, by about 1% of GDP, even considering the existing GDP output gap.
Savings, Investment, and Economic Activity
I’ve often noted that recessions aren’t simply a time when total demand falls short. They are usually a time where the mix of goods and services that is demanded becomes out of line with the mix of goods and services supplied by the economy. In order to get that mix back in line, it’s not enough to simply “stimulate demand” – it’s important to encourage innovation and investment in areas where needs aren’t being met, and to allow the transition and reallocation of resources away from areas that are no longer in demand.
To see why investment activity is so important, some basic economics will be useful. So let’s do about a month of Economics 101 in about two minutes. It will be worth the effort.
First, it is an accounting identity that the total amount of saving in the economy must be equal to the total amount of real investment in the economy (even if that investment sometimes represents the accumulation of unwanted inventories).
Economists break GDP (Y) into several pieces: consumption (C), real investment (I), government spending (G), and exports (X), less imports (M). Stick with me – there’s a payoff to this:
Y = C + I + G + X – M
Adding and subtracting taxes (T) and rearranging produces what’s called the “savings investment identity.” It basically says that all investment (factories, equipment, and so forth) must be funded by some form of savings. Taking the economy as a whole, output created by the economy that isn’t consumed by someone (savings) is what we call investment – even if that investment is unwanted inventory accumulation.

Recessions and the “Paradox of Thrift”
Since the savings-investment identity always holds without the need further assumptions, we can use it as a workhorse of economic analysis (and one that I vastly prefer to assumption-laden models using “marginal propensities,” “multipliers” and the like). One of the most widely held views about recessions is that they are caused by inadequate demand. This idea, which Keynes outlined in his General Theory, argues that recessions are caused by an unfortunate desire of consumers to increase their savings. In the Keynesian model, if consumers simultaneously try to increase their savings, they paradoxically become poorer.
The Keynesian theory of recessions is based on two assumptions:
1) Gross investment is fixed and unresponsive to interest rates
2) Individuals attempt to save a greater portion of their income
Look at the savings-investment identity, and notice the effect of these assumptions. Because savings and investment must be equal, and Keynes has already assumed that investment is fixed, the attempt by individuals to save a greater portion of their income cannot actually result in a greater amount of total savings. Instead, other things being equal, GDP must fall. There may be a million individual private decisions that produce this result, but in the end, savings must equal investment.
The Keynesian solution to this is to offset the desired increase in private savings with a decrease in government savings. Keynesians typically want savings rates to be as low as possible, on the assumption that spending automatically generates production. Keynesian theory really doesn’t embody the notion of scarcity and economic tradeoffs very well, and both government spending and investment enter the model like any other class of spending, with little attention to the productivity of that spending over time.
This is why Keynesian economists generally recommend government deficits to offset recessions. But this is only one possible solution, and the present size of the federal deficit makes a continuation of this policy dangerous.
Policy Options in a Recession
Why has economic growth been so weak in this recovery? During the past decade, and particularly during the housing boom, households accumulated unprecedented amounts of mortgage and consumer debt. Much of this debt burden remains in place, and much of the unserviceable debt has not been restructured. In this environment, the desire of households to increase private savings is reasonable. It has been difficult for economic policies (such as the Federal Reserve’s program of quantitative easing) to encourage debt-strapped households to reduce their savings and increase debt-financed consumption.
Having failed any attempt to help homeowners restructure millions of still-underwater mortgages (little wonder why so little housing is being supplied to the market when existing owners would have to take a massive out-of-pocket equity loss in order to sell), debt burdens and fragile household balance sheets continue to be a drag on demand, and propping up risky assets does not help this.
If households desire an increase in private savings, there are four possible ways to avoid a contraction in the economy:
1) Attempt to discourage private savings and increase spending against consumer desires (QEternity)
2) Attempt to reduce “foreign savings” by depreciating the currency and engaging in trade competition
3) Reduce government savings by running a budget deficit (the Keynesian solution)
4) Stimulate gross domestic investment
Consider the first option – discouraging savings and encouraging spending: While the Fed’s policy of quantitative easing has punished savers while promoting speculation in stocks, commodities, and other assets, it has done little to encourage additional consumer spending. There is a good reason for this. Consumers tend to consume from what they view as their “permanent income.” It should be well-known to the Federal Reserve that each 1% change in stock market capitalization has affected real GDP by only about 0.03-0.05%, and even that effect is usually transient. Further efforts at quantitative easing have no place in thoughtful economic policy, and threaten to prove very difficult to unwind without substantial disruption to the economy and financial markets.
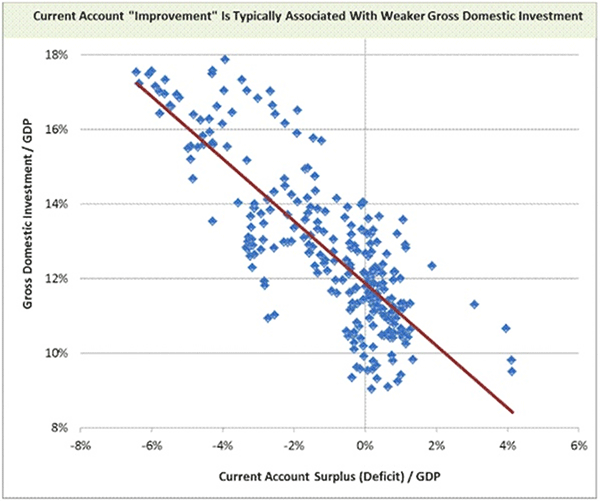
What about trade competition and dollar devaluation? This strategy aims to offset the desire for increased domestic savings by reducing the size of “foreign savings” (essentially the opposite of the U.S. current account balance) through dollar devaluation, trade wars, and other beggar-thy-neighbor policies. Unfortunately, even successful attempts to “improve” the trade deficit are likely to be counterproductive. The reason is that there is an extremely high correlation between trade deficits and gross domestic investment: apparent “improvements” in the trade deficit are strongly associated with deterioration in gross domestic investment. So while beggar-thy-neighbor policies may be attractive in theory, they are unlikely to be effective in practice.
The co-movement of trade deficits and gross investment was seen most recently in the GDP revision of Q4 2012. Many analysts expected a very positive GDP revision as the result of a smaller-than-expected trade deficit. Instead, the “improved” trade deficit turned out to be offset by a reduction in investment (particularly inventories), resulting in a disappointingly small net revision to GDP.
The upshot is this. The combined attempt of households and government to increase saving and reduce debt is unlikely to be countered by continued policies of quantitative easing, nor by attempts at beggar-thy-neighbor trade policies. Further deficits are not a viable option, and threaten undesirable long-term consequences. The ideal solution is to pair deficit reduction efforts with policies to stimulate gross domestic investment. “Investment” in this context does not mean financial investment, but real investment in factories, equipment, capital goods, research, and development. Policies to stimulate investment include investment tax credits, accelerated expensing of investment, R&D incentives, and similar programs.
Put simply, the "paradox of thrift" and the Keynesian response to recession (government deficit spending) both rely on the assumption that gross domestic investment is fixed despite a desired increase in private saving. Stimulate real investment, and the paradox of thrift vanishes. As a result, sustained government deficits become unnecessary.
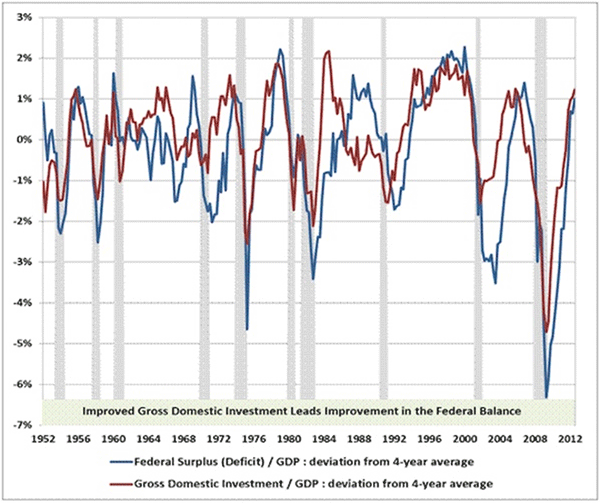
Importantly, significant deficit reduction is unlikely to succeed without increased gross domestic investment. In fact, increases in gross domestic investment tend to lead both improvement in the budget balance, and increased consumption spending. In the chart below, gross investment and the federal surplus are presented as deviations from their respective 4-year averages. Notice that improvements in gross domestic investment (red line) typically occur before corresponding improvements in the budget balance (blue line).
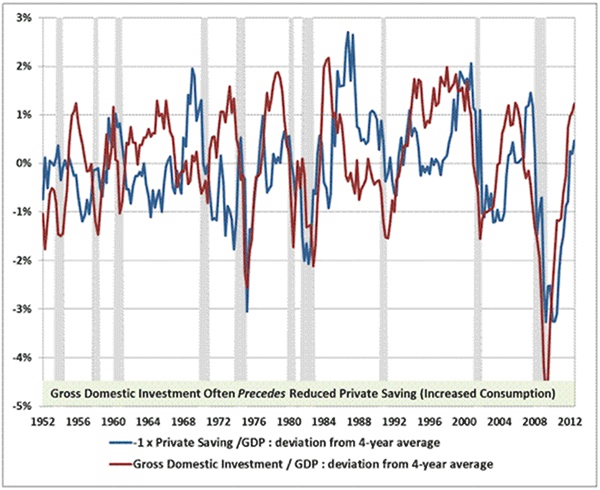
Similarly, improvements in gross domestic investment tend to precede increased consumption and reduced private saving.
Attempts to “stimulate” the economy by suppressing savings and increase consumption, or by pursuing “beggar thy neighbor” exchange rate policies are weak options compared to policies that encourage productive investment, research, and development. A nation’s “standard of living” is reflected by the amount of goods and services that its people can consume as a result of their efforts. A nation’s “productivity” is reflected by the amount of goods and services that its people can produce as a result of their efforts. Ultimately, one cannot increase for long without the other. Robust domestic investment provides the foundation for both.
The only sustainable course to a higher standard of living is to encourage productive investment. Policies like those currently pursued by the Federal Reserve attempt to encourage consumption, but do so by distorting savings and investment decisions toward speculative activity rather than productive investment. Unfortunately, the reluctance of consumers to spend is tightly linked to existing mortgage and consumer debt burdens, many of which remain unserviceable and have not been restructured. Attempts to squeeze greater consumption demand from these individuals, without a strategy to increase productive activity and income, is likely to produce continued failure.
While policies to stimulate gross domestic investment may be viewed as unwanted “tax expenditures” in deficit reduction efforts, these policies are critical to prevent the unintended consequence of economic contraction.
Fred Smith, the CEO of FedEx, recently observed “The only thing that’s correlated 100% with job creation – and particularly good job creation – is business investment. It’s our reduced level of capital investment that has produced our low GDP growth rates and our high unemployment.”
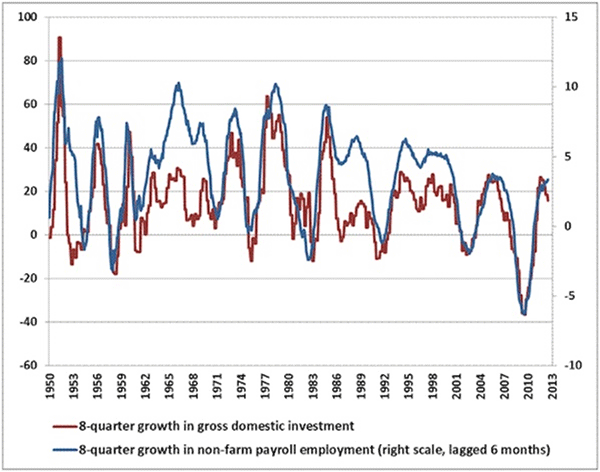
Well, the correlation isn’t quite 100%, but his point is accurate. The correlation between 8-quarter growth in gross domestic investment and 8-quarter growth in non-farm payroll employment is 80%, with payroll growth lagging investment growth by about 6 months. Notably, that correlation is not driven by linear trends, but instead by a close match between cyclical movements of both, with employment lagging investment activity.
Growth in gross domestic investment has already turned lower, and while employment growth doesn’t move in lock-step, it’s fair to say that investment growth is moving in the wrong direction if job creation is an objective of economic policy. All of the QE in the world will not help this situation, but will instead continue to distort investment decisions away from productive allocation of capital and toward brute speculation in financial assets that are already priced to achieve dismal long-term returns.
John Mauldin
subscribers@MauldinEconomics.com
Outside the Box is a free weekly economic e-letter by best-selling author and renowned financial expert, John Mauldin. You can learn more and get your free subscription by visiting www.JohnMauldin.com.
Please write to johnmauldin@2000wave.com to inform us of any reproductions, including when and where copy will be reproduced. You must keep the letter intact, from introduction to disclaimers. If you would like to quote brief portions only, please reference www.JohnMauldin.com.
John Mauldin, Best-Selling author and recognized financial expert, is also editor of the free Thoughts From the Frontline that goes to over 1 million readers each week. For more information on John or his FREE weekly economic letter go to: http://www.frontlinethoughts.com/
To subscribe to John Mauldin's E-Letter please click here:http://www.frontlinethoughts.com/subscribe.asp
Copyright 2013 John Mauldin. All Rights Reserved
Note: John Mauldin is the President of Millennium Wave Advisors, LLC (MWA), which is an investment advisory firm registered with multiple states. John Mauldin is a registered representative of Millennium Wave Securities, LLC, (MWS), an FINRA registered broker-dealer. MWS is also a Commodity Pool Operator (CPO) and a Commodity Trading Advisor (CTA) registered with the CFTC, as well as an Introducing Broker (IB). Millennium Wave Investments is a dba of MWA LLC and MWS LLC. Millennium Wave Investments cooperates in the consulting on and marketing of private investment offerings with other independent firms such as Altegris Investments; Absolute Return Partners, LLP; Plexus Asset Management; Fynn Capital; and Nicola Wealth Management. Funds recommended by Mauldin may pay a portion of their fees to these independent firms, who will share 1/3 of those fees with MWS and thus with Mauldin. Any views expressed herein are provided for information purposes only and should not be construed in any way as an offer, an endorsement, or inducement to invest with any CTA, fund, or program mentioned here or elsewhere. Before seeking any advisor's services or making an investment in a fund, investors must read and examine thoroughly the respective disclosure document or offering memorandum. Since these firms and Mauldin receive fees from the funds they recommend/market, they only recommend/market products with which they have been able to negotiate fee arrangements.
Opinions expressed in these reports may change without prior notice. John Mauldin and/or the staffs at Millennium Wave Advisors, LLC and InvestorsInsight Publishing, Inc. ("InvestorsInsight") may or may not have investments in any funds cited above.
Disclaimer PAST RESULTS ARE NOT INDICATIVE OF FUTURE RESULTS. THERE IS RISK OF LOSS AS WELL AS THE OPPORTUNITY FOR GAIN WHEN INVESTING IN MANAGED FUNDS. WHEN CONSIDERING ALTERNATIVE INVESTMENTS, INCLUDING HEDGE FUNDS, YOU SHOULD CONSIDER VARIOUS RISKS INCLUDING THE FACT THAT SOME PRODUCTS: OFTEN ENGAGE IN LEVERAGING AND OTHER SPECULATIVE INVESTMENT PRACTICES THAT MAY INCREASE THE RISK OF INVESTMENT LOSS, CAN BE ILLIQUID, ARE NOT REQUIRED TO PROVIDE PERIODIC PRICING OR VALUATION INFORMATION TO INVESTORS, MAY INVOLVE COMPLEX TAX STRUCTURES AND DELAYS IN DISTRIBUTING IMPORTANT TAX INFORMATION, ARE NOT SUBJECT TO THE SAME REGULATORY REQUIREMENTS AS MUTUAL FUNDS, OFTEN CHARGE HIGH FEES, AND IN MANY CASES THE UNDERLYING INVESTMENTS ARE NOT TRANSPARENT AND ARE KNOWN ONLY TO THE INVESTMENT MANAGER.
John Mauldin Archive |
© 2005-2022 http://www.MarketOracle.co.uk - The Market Oracle is a FREE Daily Financial Markets Analysis & Forecasting online publication.


