


Stock Market Trend Forecast Hot Sector ETF’s
Stock-Markets / Stock Markets 2013 Mar 14, 2013 - 03:25 AM GMTBy: Chris_Vermeulen

 Trading with the trend should be your main focus for long term success no matter what type of trader you are (Options Trader, Stock Trader, or ETF Trader) although it’s not as easy as it sounds.
The good news is that there is a simple trading model that removes 95% of trading analysis and greatly reduces trading related emotions because the key technical analysis rules based on one of the world’s best chart technicians (John Murphy) technical analysis methods have been applied to the chart automatically. The key is to identify the trend of the market. Once that is known you can focus on trading strategies that take advantage of the current trend.
Over the past few years I have been creating this indicator/chart layout tool which converts my chart reading experience, tips and tricks into a simple system removing analysis paralysis which cause most individuals to second guess what they see and don’t pull the trigger. Using too many indicators or read/listening several other traders commentaries with different views than you causes this paralysis.
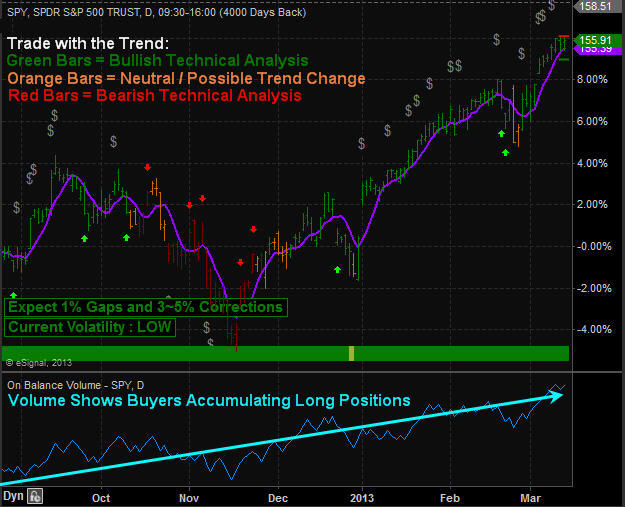
My simple red light, green light model clearly shows a viewer the current trend and expected price range (high and low) looking forward a couple days. I uses a series of data points like volatility, volume, cycles, momentum, chart patterns and logic rules. It even shows extreme pivot points helping you find low risk entry prices for both bull and bear market conditions.
Recent trends and signals for the SP500 Index Daily Chart:
Trading With the Trend – The Sweet Spots
Knowing the direction of the market is simple using the chart system above but trading with the trend is not that simple because of natural human behavior. Instead traders fall victim to trying to pick a top or bottom because they think the price is overbought or oversold and they want to catch the next big trend change.
We all know the saying “the market climbs a wall of worry”. Well, the biggest worry most traders have is buying long in a bull market because stocks and price always look overbought and ready to top each week… This leads to people trying to get fancy picking a top only to get their head handed to them a few days or weeks later depending on how stubborn they are to exit a losing position.
The key to long term success is to buy during broad market (SP500) corrections once sentiment, cycles and momentum are starting to flash extreme oversold conditions. These show up as green arrows on the trend chart. At that point most sectors and high beta stocks like IBM, GOOG etc… should be at a key entry points with most of the downside risk removed already. Remember ¾ stocks follow the broad market so it only makes sense to follow it also.
What about a runaway stock market? This is when the stock market does not pullback but just keep grinding its way higher and higher… The only thing you can do is sit in cash, or look for a stock or sector that is having a small pause or pullback and get long with a small position until you get that broad market pullback and major by signal to add more.
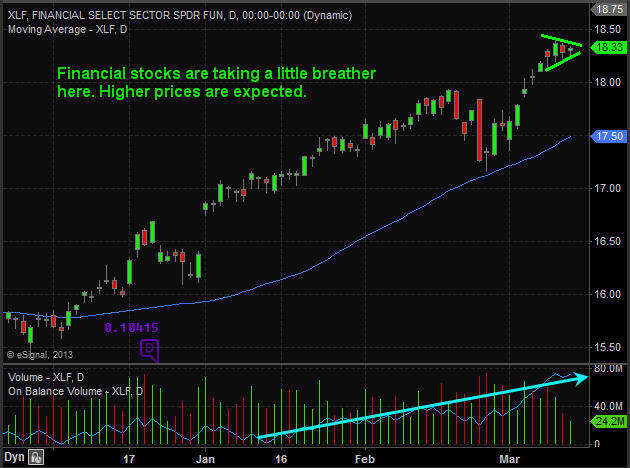
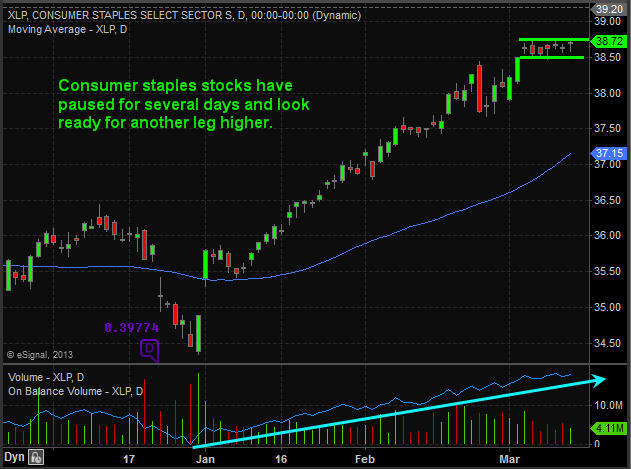
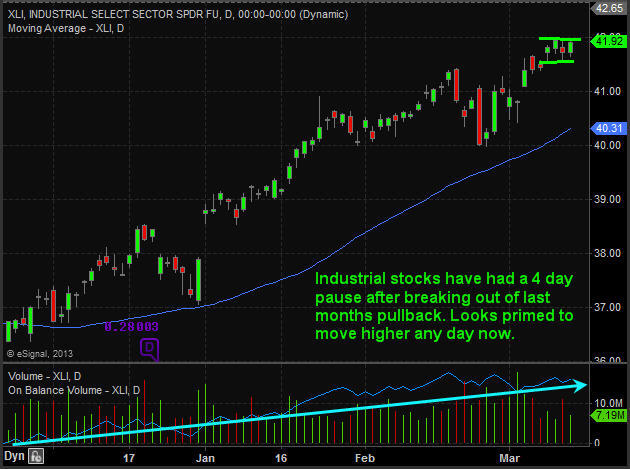
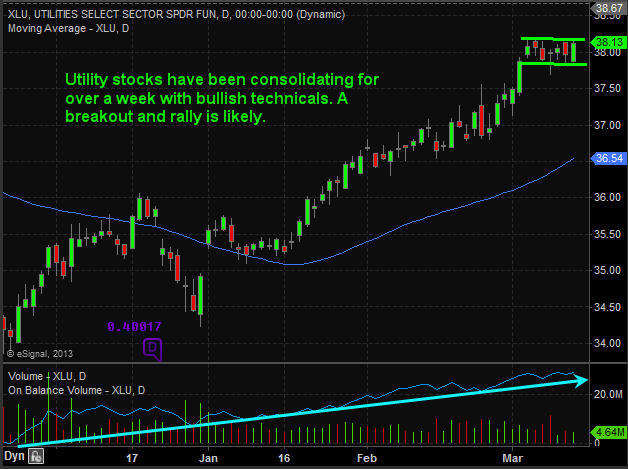
Below are a few sectors showing a minor pause/pullback within this bull market.
Mid-Week Trend Conclusion:
Overall, the broad market remains in an uptrend. While I would like to see the SP500 pullback and give us another major buy signal like it did in December and February I do mind that much if prices keep running higher as it just give us more cushion and potential profits for when the trend does eventually roll over and flip signals. I hope you found this report interesting. It’s just scratching the surface of this topic but it’s a start.
If you would like to keep up to date on market trends and trade ideas be sure to join my newsletter at http://www.thegoldandoilguy.com
By Chris Vermeulen
Please visit my website for more information. http://www.TheGoldAndOilGuy.com
Chris Vermeulen is Founder of the popular trading site TheGoldAndOilGuy.com. There he shares his highly successful, low-risk trading method. For 7 years Chris has been a leader in teaching others to skillfully trade in gold, oil, and silver in both bull and bear markets. Subscribers to his service depend on Chris' uniquely consistent investment opportunities that carry exceptionally low risk and high return.
This article is intended solely for information purposes. The opinions are those of the author only. Please conduct further research and consult your financial advisor before making any investment/trading decision. No responsibility can be accepted for losses that may result as a consequence of trading on the basis of this analysis.
Chris Vermeulen Archive |
© 2005-2022 http://www.MarketOracle.co.uk - The Market Oracle is a FREE Daily Financial Markets Analysis & Forecasting online publication.