


Are You Ready For Stock Market Flash Crash Next Week?
Stock-Markets / Financial Markets 2013 Mar 16, 2013 - 08:13 PM GMT

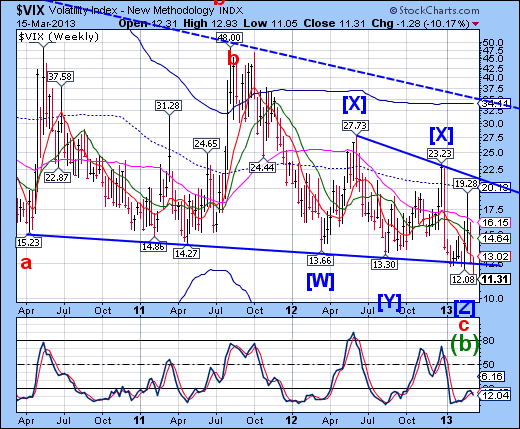
 VIX “threw under” its Ending Diagonal this week in what may be its Master Cycle low. This would be the lowest reading for the VIX since December 2006, when it reached 9.39. There was no Ending Diagonal at the 2006 low, however. Diagonals imply an “immediate” and complete retracement from the peak, which was the November 2008 high.
SPX has its first Friday loss….
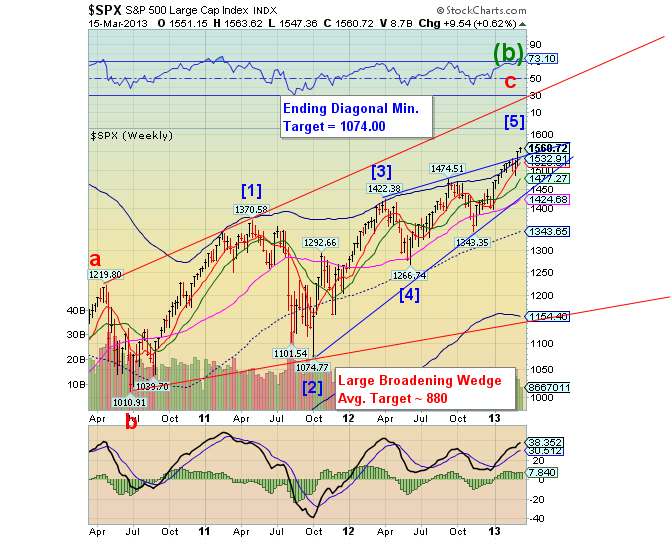
-- SPX spent the second week in the throw-over of its Ending Diagonal upper trendline. Ending Diagonals most often have a 78.6% relationship between waves. This one does not, making it difficult to identify and track. However, using that relationship as a guideline, the SPX has reached its “ideal length” at 1540.00. In the final stretch, Wave 5 is 78.6% the size of Wave 1 at 1566.13. There’s not much left to finish this pattern.
(ZeroHedge) The streak is dead - long live the streak - for the first losing Friday of the year. A sad day among the media though Maria B did proclaim "today was a victory even though we were down," so we can rest assured that all is well.
NDX sits on the edge of a dangerous formation.
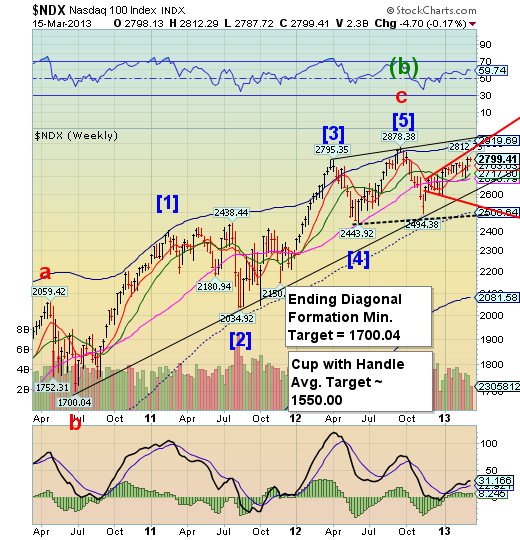
--The NDX simply ran out of steam this week. The NDX has been signaling weakness since mid-November. It rests just above Model supports, which run out at 2690.79. The Ending Diagonal is triggered just above 2600.00. Things may happen rather quickly after that.
(ZeroHedge ) Forget Rachel Fox - the 16 year old actress-*****-Jesse-Livermore, now we have 11-year-old Rachel Kelly from Naperville who is touted as an example of the greatness of our education system by CNBC because, "because people are going to need to trade stocks long after we're gone... it's inspiration for other 11-year-olds out there." Indeed we are.
The Euro sits on a small Head & Shoulders neckline.
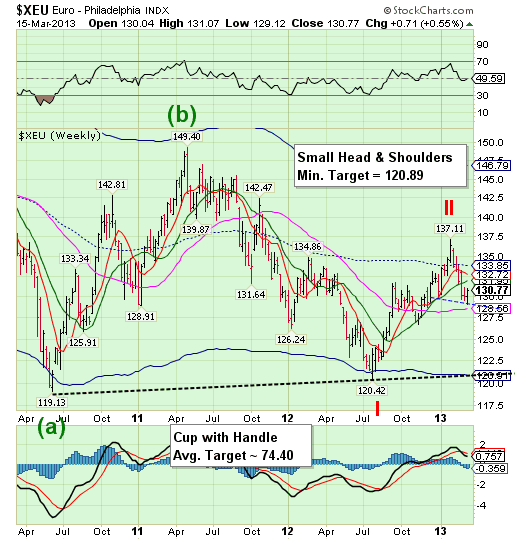
-- The Euro found support at 129.00 at what appears to be a Head & Shoulders neckline. It appears that there may be a bit more of a bounce before it rolls over, crossing its neckline and its Long-term Support at 128.56. This may be the last bastion of support for the Euro prior to a decline to its Cup with Handle formation at 120.95. The Cycles Model suggests a decline in the Euro into mid-March, which may take the Euro well below that level.
(EconomicCollapseBlog) When you get into too much debt, eventually really bad things start to happen. This is a very painful lesson that southern Europe is learning right now, and it is a lesson that the United States will soon learn as well. It simply is not possible to live way beyond your means forever. You can do it for a while though, and politicians in the U.S. and in Europe keep trying to kick the can down the road and extend the party, but the truth is that debt is a very cruel master and at some point it inevitably catches up with you. And when it catches up with you, the results can be absolutely devastating.
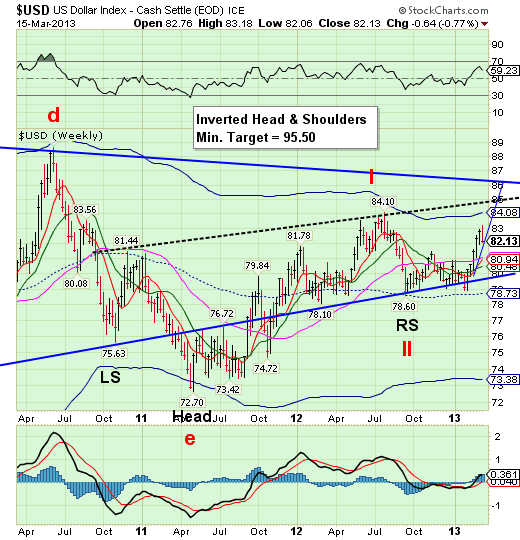
The US Dollar tests a trendline.
-- USD took a brief pause in its rally toward the neckline of a large inverted Head & Shoulders formation. The Cycles Model now implies that USD may resume its rally for the next week or two in order to meet its target at the Head & Shoulders formation at 85.00. This may offer the base for a new Primary Cycle rally that may surprise many with its strength in its strongest phase above the neckline.
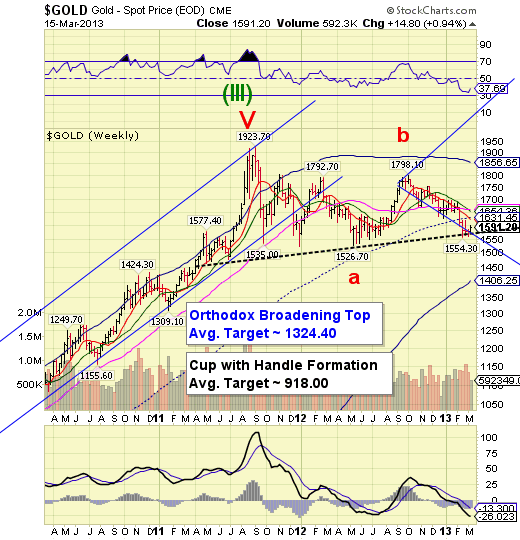
Gold rests on a trap door.
-- Gold rested atop the Lip of its Cup with Handle formation at 1560.00 for three weeks before making another attempt at overhead resistance. There may be a chance of a brief spike back up to mid-Cycle resistance at 1631.45 or higher as cash rotates out of equities but the rally is running out of time. On the other hand, a flash crash may be imminent. The two formations on the chart are a lethal combination when triggered. Caution is advised.
(ZeroHedge) We have one simple question - does the following small drop (which we happen to have seen before) in Gold ETFs, which at least according to the mainstream media, has been responsible for the recent slide in the price of gold, appear to justify the absolute surge in gold futures and options short exposure as per the Commitment of Traders report, which for yet another week, saw the biggest net short positioning since 1999. Do the Commercial Hedgers read the charts? You bet they do!
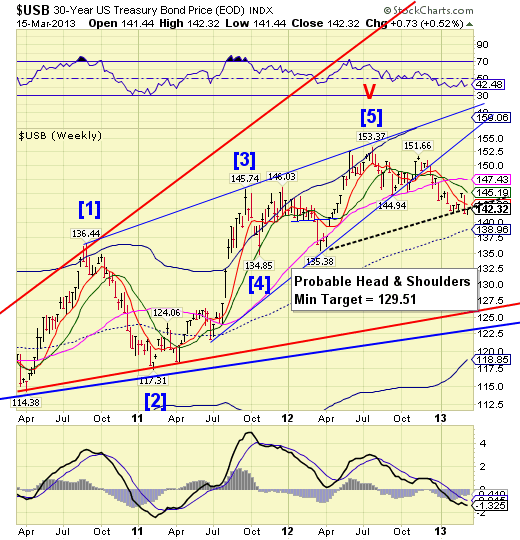
Treasuries may be testing a neckline.
-- USB appears to have fallen through a probable Head & Shoulders neckline at 142.50. Treasuries are going into the most powerful part of their decline as they decline into a Primary Cycle decline that may last another month. The most probable target may be the 32-year long trendline near 122.50, or beneath that, at weekly Cycle Bottom support at 118.85.
(ZeroHedge) Curious why Treasury yields have ground lower this morning, considerably more than would perhaps be expected given the consumer sentiment data, and in the process have prevented the intraday "rotation" out of bonds into stocks, pushing the DJIA higher for the 11th consecutive day? The answer comes from the Fed which tipped its hand earlier and scared a few big bond shorts by issuing a Large Positions Reports from those entities which own more than $2 billion of the 2% of February 2023 (CUSIP: 912828UN8 auctioned off in February and reopened on Wednesday). (Hint: The Fed pre-monetized a 30-year bond issue on Thursday and now there is a fail to deliver.)
Crude is between support and resistance.
-- West Texas Intermediate Crude continued its corrective bounce toward mid-Cycle resistance at 94.81. Don’t expect the rally to last, however, since it it has a date with Cycle Bottom support and the Head & Shoulders neckline in the next two weeks.
(OilPrice.com) The United States is expected to lead the pack among non-OPEC members in terms of oil supply growth for 2013. That's the assessment from this month's market report from the Vienna-based cartel. OPEC said it projected U.S. oil supply growth of around 600,000 barrels per day in 2013, with most of that coming out of tight oil formations in the country. For the U.S. Energy Department's Energy Information Administration, that means oil imports should fall to their lowest level since 1985.
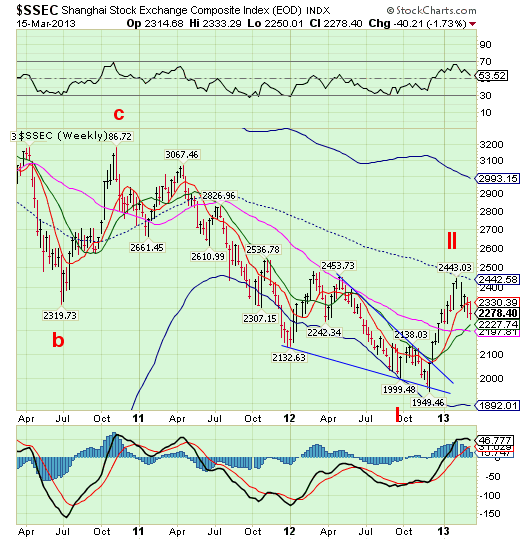
China stocks continue their slide.
--This week the Shanghai Index resumed its decline toward Intermediate-term and Long-term support at 2227.74 and 2197.81, respectively. Below that is potential free-fall territory as Cycle Wave III begins. The Cycles Model indicates that there may be 3 more weeks of decline before the Shanghai Index takes a break.
(ZeroHedge) As Marc Faber noted, we hardly expect China to report GDP growth rates that do not perfectly fit the goal-seeked solution for utopian society, but under the covers, there appears to be some considerably more ugly real data. One of the hardest to manipulate, manage, or mitigate for a centrally planned economy is Electricity production. The year-over-year drop in China's electricity production is the largest since the slump in Q1 2009; and the seasonal drop (associated with the New Year) is the largest on record at 25.3%!
The India Nifty retracement is over.
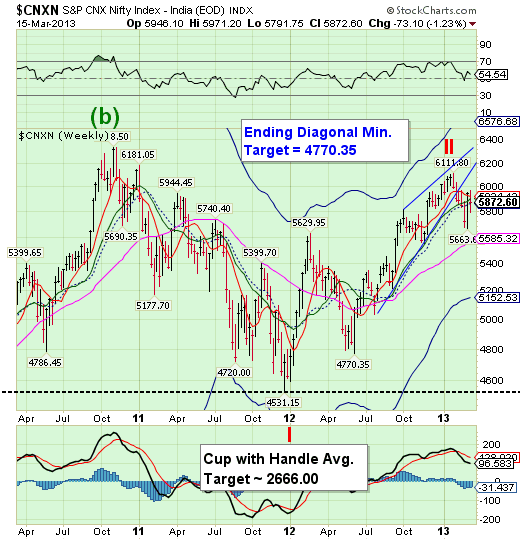
The India Nifty rally fizzled and it has fallen back beneath its support/resistance levels. Bear Market retracements may be strong, but they inevitably fail, since most of the fuel for the rally is short covering and no nreal buyers appear. CNXN has lost all but its long-term support, leaving a potential free-0fall scenario to or through Cycle Bottom support at 5152.53.
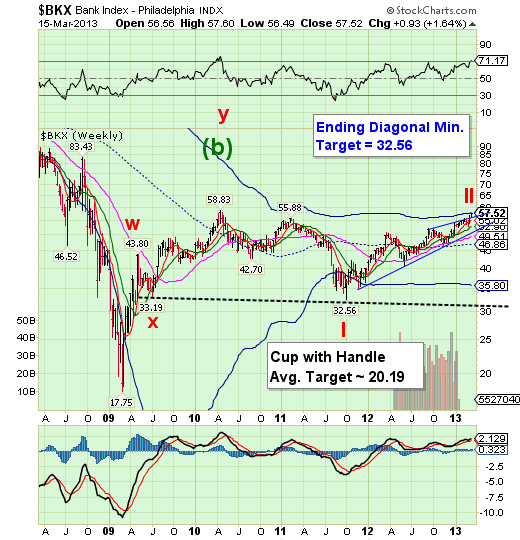
The Bank Index had a date with its Cycle Top.
-- BKX apparently would not stop until it met its Cycle Top at 57.92. This rally is becoming very old in the tooth and demands a complete retracement when it breaks down. Time may have just run out for this decline. However, instead of making it milder, the decline may end in a Flash Crash as very deep targets must be met in a shorter period of time. The next two weeks may turn ugly for BKX.
(ZeroHedge) On April 13, 2012 Jamie Dimon described the situation at the CIO as massively overblown and said it was just "a tempest in a teapot." A few days later, the head CIO trader, Javier Martin-Artajo, when speaking to the former JPM Chief Investment Officer, Ina Drew, had a less sanguine description: "and, and, you know, things like this, it's like the twin towers falling down."
There is more news out of the JPM hearing, such as the email that ended the career of JPM’s chief risk officer. For those curious about the timeline of the world's biggest prop-desk blow up, here it is day by day and, pardon the pun, blow by blow.
And the piece de resistance from Ina Drew:
- Since my departure I have learned of the deceptive conduct by members of the London team, and I was, and remain, deeply disappointed and saddened to learn of such conduct and the extent to which the London team let me, and the Company, down.
Of course JPM’s political lobbying will pay off big. Nothing will come of this hearing.
We end on that note.
Regards,
Tony
Our Investment Advisor Registration is on the Web
We are in the process of updating our website at www.thepracticalinvestor.com to have more information on our services. Log on and click on Advisor Registration to get more details.
If you are a client or wish to become one, please make an appointment to discuss our investment strategies by calling Connie or Tony at (517) 699-1554, ext 10 or 11. Or e-mail us at tpi@thepracticalinvestor.com .
Anthony M. Cherniawski, President and CIO http://www.thepracticalinvestor.com
As a State Registered Investment Advisor, The Practical Investor (TPI) manages private client investment portfolios using a proprietary investment strategy created by Chief Investment Officer Tony Cherniawski. Throughout 2000-01, when many investors felt the pain of double digit market losses, TPI successfully navigated the choppy investment waters, creating a profit for our private investment clients. With a focus on preserving assets and capitalizing on opportunities, TPI clients benefited greatly from the TPI strategies, allowing them to stay on track with their life goals
Disclaimer: The content in this article is written for educational and informational purposes only. There is no offer or recommendation to buy or sell any security and no information contained here should be interpreted or construed as investment advice. Do you own due diligence as the information in this article is the opinion of Anthony M. Cherniawski and subject to change without notice.
Anthony M. Cherniawski Archive |
© 2005-2022 http://www.MarketOracle.co.uk - The Market Oracle is a FREE Daily Financial Markets Analysis & Forecasting online publication.