


First Iceland then Greece Now Cyprus and Who is next in Asia ..?
Stock-Markets / Credit Crisis 2013 Mar 25, 2013 - 02:27 PM GMTBy: Sam_Chee_Kong

 Ever wonder why the shit is starting to hit the fan (SHTF) in Europe now? This kicking the can down the road thingy will have to come to an end one day. The whole financial system is on the verge of collapsing right now as every available effort utilized to pump up the system seems to be going nowhere. Ever since the financial crisis erupted in 2008, the system has been kept afloat by pouring more money into it. Unfortunately the unlimited injection of funds by means of Quantitative Easing has not been very effective as of late mainly because most of it went to unproductive sectors such as the real estate and stock market. Thus what we are ended up is inflated property and stock prices which resulted in a Great Disconnect between the asset prices and the real economy.
The Great Disconnect
What do we mean by the Great Disconnect? It means asset prices and the real economy is moving in different directions. In normal conditions the movement of the stock market follows the economy, meaning if the economy improves then the stock market will follow. However such a relationship does not seem to exist anymore. It seems that the age old investing axiom of good-is-good and bad-is-bad does not hold anymore. What does it mean? A classic case for the good-is-bad is the following. In the olden days when a company announces better than expected earnings its share price will normally go up but nowadays it reacted on the opposite and its stock price plunges. This has baffled many investors for many years.
Similarly when a dodgy company from a low-growth industry announces cost cutting measures such as laying off workers, cutting overtime, no pay rise and bonus, its share price jumped because the public viewed that its projected future earnings will somehow be improved due to the measures taken currently. This is a classic case of bad-is-good because cost cutting measures will only help to improve the bottom line of the company in the short term and will not be sustainable in the long run because there are only so much costs and wages to cut. To achieved a sustainable earnings improvement the company should seek out measures to improve the efficiency of the company and thus to bring in a sustainable sales improvement in the future.
In fact there is currently a Great Disconnect between the financial markets and the Global economy. They no longer follow the axiom of good-is-good and bad-is-bad. The situation has already reached the point where the badder-the-news then the-better-the-market. Heck, currently the situation in Cyprus can be considered critical with threatening bank runs and the closure of its two main banks namely Bank of Cyprus and Cyprus Popular Bank. Thanks for the manipulation by the authorities; stock markets around the world are making record highs instead of plunging. They had no choice because the financial market is their last line of defence against the collapse of the entire global financial system and economy.
But many policy makers failed to realise that it is this very act of saving their financial markets by artificially propping them up is what kills them. Failed and uncompetitive companies and too big to fail banks are bailed out with tax payers money. As a result of such moves the global financial market has turned into a giant casino. Currently the Global GDP is worth about $70 trillion with the total derivatives bet around the world estimated to be between $800 and $1500 trillion. This means the total bets on derivatives had reached a leverage of more than 10x the world GDP. If this house of cards were to come down anytime in the future, how are we going to survive?
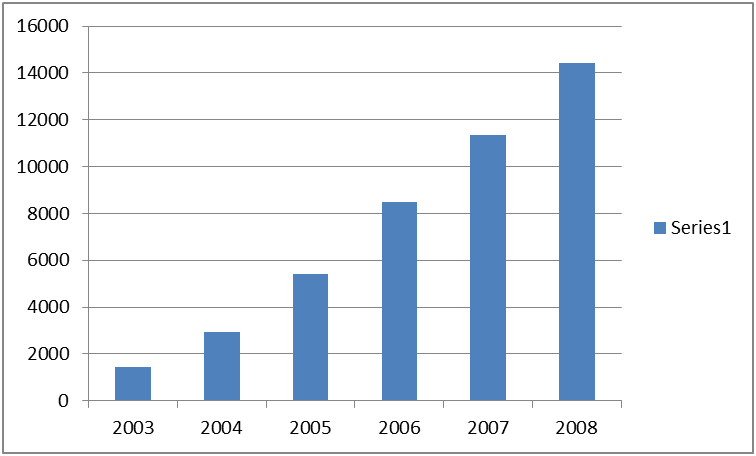
We believed that Central Banks around the world has lost this battle when Iceland went down in 2008. One of the main causes of the collapse of Iceland is due to the rapid growth of its balance sheet and assets of the three main banks namely Glitnir, Kaupthing and Landsbanki. The following table is the total assets (in ISK) of the three banks from 2003 to 2008.
Chart 1 (Combined Assets of 3 main banks of Iceland)
New Bank Assets (Deposits) to GDP ratio
As can be seen from the above the total assets of the three biggest banks in Iceland gone up tremendously since 2005 and by 2008 it had grown by more than 250%. At that time the GDP of Iceland was only worth ISK14 billion. So how exposed are the Icelandic banks since more deposits means more lending? A new financial metric to stress test banks introduced by Bloomberg is the Bank Assets to GDP ratio. Hence Iceland’s Bank Assets/GDP ratio is more than 10x (144/14) which is one of the highest at that time. With such a high leverage it did not take long for the financial crisis in 2008 to wipe out the Icelandic banking system.
Coming back to present – Cyprus
Cyprus has long been an offshore haven for foreign investors especially the Russians. Due to the massive inflow of funds, Cyprus banks started to invest in Greek Government Bonds to the tune of €4.7 billion. So when Greece went through the restructuring and austerity measures last year so does the fortunes of the Cyprus Banks. As a result The Bank of Cyprus and Popular bank of Cyprus has lost an estimated of €3.5 billion which is about 20% of Cyprus’s GDP. Cyprus is another country that depended much on its banking sector. Its banking sector is much larger than its economy. It is estimated that the total assets of Cyprus Banks is more than 8 times the GDP or Banks Assets/GDP ratio is more than 8x. The following is the Chart on Bank Assets/GDP for selected European countries.
Chart 2 (European Bank Assets/GDP)
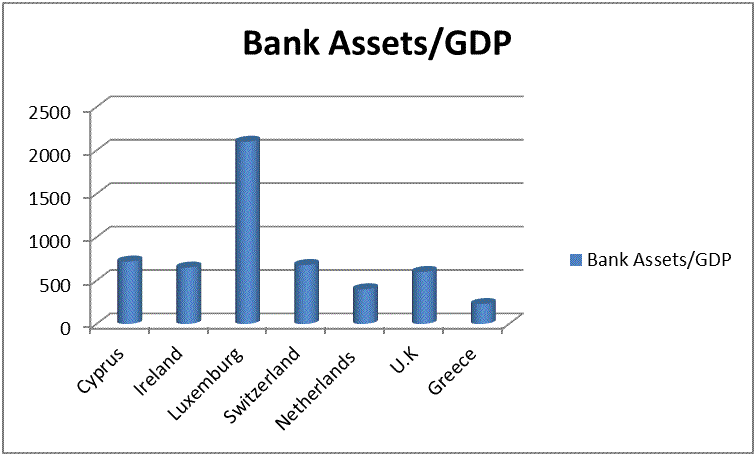
Source : World Bank
How about the rest of Europe?
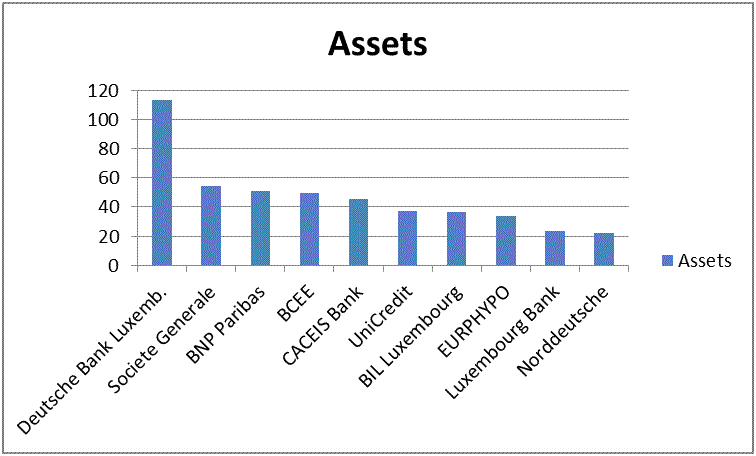
Again as you can see other than Cyprus countries such as Ireland (550%), Luxembourg (2100%), Switzerland (680%) and U.K (600%) are definitely at risk being the next victim. Three banks in Luxembourg had already seeked financial assistance to the tune of €1 billion last week. We present to you the two European countries with the highest Bank Assets/GDP ratio. Presenting our number one candidate is Luxembourg. The following table exhibits the top 10 banks by total assets in Luxembourg.
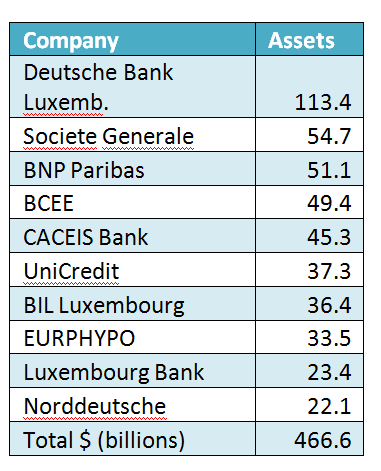
Chart 3 (Luxembourg banks by Assets)
Source : World Bank
The following is the composition of the banks with the largest assets that make up the Swiss banking sector. The following table shows the assets held by the top 10 banks in Switzerland. UBS’s assets are already more than twice the GDP of Switzerland (€593 billion) and when all of its banking assets are added up together it will certainly qualify Switzerland as a mega-bank country.
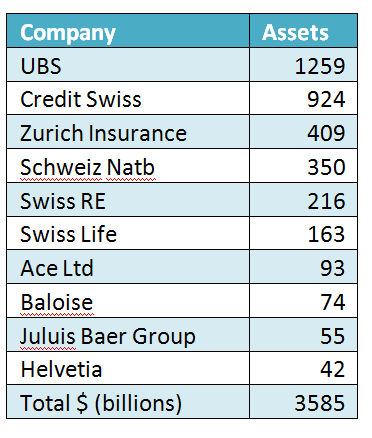
Source : Bloomberg
Chart 4 (Swiss Bank by Assets)
Do you notice the similarities between them? The assets of top 4 banks in each country accounted for almost 5x their GDP. As for Luxembourg the total assets of the top 4 banks are $268.6 while its GDP is $55 billion (2011 figures) which gives a Bank Assets/GDP ratio of 4.88x. While Switzerland’s top 4 banks assets totalled €2942 billion while its GDP is €593 which give a Bank Assets/GDP of 4.96x. That means the risk of the entire banking system fell on just a few banks. Hence if any of the top 4 banks were to be in trouble then it will greatly affects their banking system.
How about Asia?
Based on the Bank Assets/GDP ratio as an indicator of the health of a country’s banking system, Singapore and Hong Kong will certainly qualify as the most likely candidates to suffer when the next financial crisis hits. Singapore which is dubbed as ‘The Switzerland of Asia’ has been lucky being on the receiving end of the mass exodus of funds from Switzerland in the past few years. Due to the crackdown by the authorities and also the pressure from Western governments to open up the secrecy of the Swiss Banking industry, many well to do investors who feared clampdown from the authorities, transferred their funds to Singapore.
As a result total assets of its banks have grown rapidly over the past few years. The following is the breakdown of the top ten banks in Singapore based on their assets. Again at top of the heap is Malacca Trust whose assets are more than 3 times the GDP of Singapore ($305 billion). Their total assets are more than 7x the GDP of Singapore.
Another country that is worth mentioning here is Hong Kong whose Bank Asset/GDP ratio has risen to 6.2x recently. However we are confident that Hong Kong will be able to weather any financial storm as it has the backing of China.
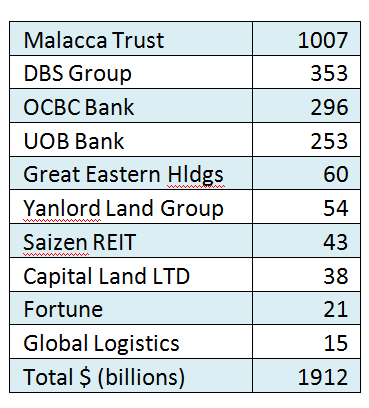
Source : Bloomberg
Chart 5 (Singapore Banks by Assets)
Conclusion
What we found from our analysis is that in all the cases there seems to be a pattern of ‘too few controlling too much’. By this we mean that the control of a country’s finances fell to only a few players which we reckon is very risky. In an event of a financial crisis the survivability of a country will be at stake.
However we believed that most Asian countries are able to weather the coming financial crisis much better than their European counterparts because their fundamentals are still strong. Most of them are running budget surpluses and also the interest rates in the region are still way above zero. Thus it will give them some extra ammunition in their monetary policy arsenal to fight any economic downturn before resorting to other means. Singapore and Hong Kong which recorded a Bank Asset/GDP of 7.7x and 6.2x will certainly be of interest if the financial crisis in Europe were to spread to Asia. How well they are able to overcome the crisis and whether the authorities will resort to raiding the bank account of depositors ala Cyprus is left to be seen.
by Sam Chee Kong
cheekongsam@yahoo.com
© 2013 Copyright Sam Chee Kong - All Rights Reserved
Disclaimer: The above is a matter of opinion provided for general information purposes only and is not intended as investment advice. Information and analysis above are derived from sources and utilising methods believed to be reliable, but we cannot accept responsibility for any losses you may incur as a result of this analysis. Individuals should consult with their personal financial advisors.
© 2005-2022 http://www.MarketOracle.co.uk - The Market Oracle is a FREE Daily Financial Markets Analysis & Forecasting online publication.