


Fed Fails to Crush Gold Price, Bullion Demand Triggers Strong Bounce
Commodities / Gold and Silver 2013 Apr 25, 2013 - 08:30 AM GMT

 There’s an awful lot of noise that passes as news out there, and most of it is related to just how good the stock market looks and just how bad gold looks. Bloomberg did another ten minutes on fifty reasons not to buy the yellow metal this morning. They are negative pieces on gold every single day, and sometimes two or three times a day. I’ve been around a long tome and I’ve never seen anything quite like it, except when the media was pushing stocks back in 1999 with “Dow 25,000,” and we all know how that turned out. Maybe it’s just me but when everybody tells me to go one way, I have to take a good look at what’s in the other direction.
Let’s start out by taking a look at a weekly chart that takes in the entire bull market (2001 to date):
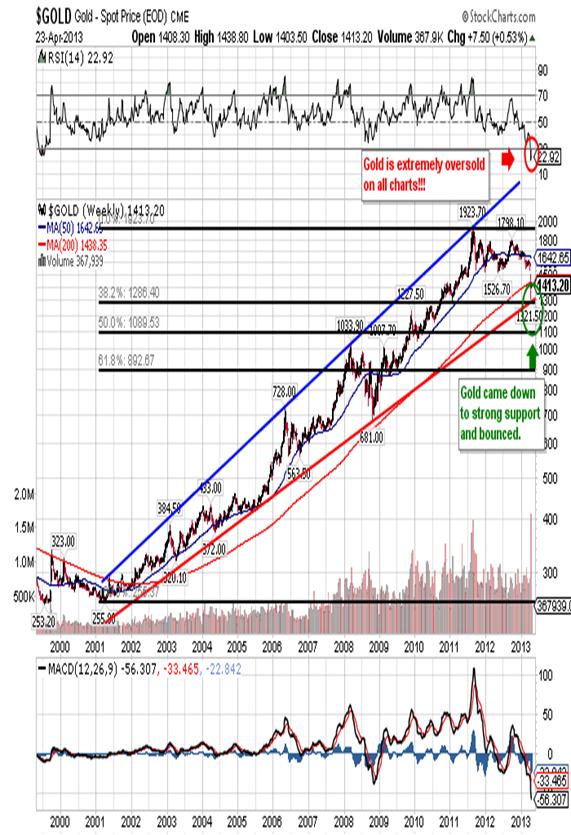
I see a number of strange things here, but none of them are bearish! The first thing I see is that gold came down to the bottom band of its trend line and bounced. This is something that’s occurred on two other occasions and each time it signaled the beginning of a massive rally. Since I know that markets tend to repeat themselves, that’s a good sign.
Now I would like you to look at the top of the chart and focus on the Relative Strength Index, also known as the RSI. RSI dipped as low as 15 and was at least down to 20 in the daily, weekly (shown here) and monthly charts. Those are reading that have never occurred in the bull market and I couldn’t find a reading of 15 going back forty years! A reading of thirty indicates something is extremely oversold, and a reading of 15 indicates they are giving it away on the street and absolutely no one wants it. Even today with the $100 bounce the RSI reading is at or below 30 in the daily, weekly and monthly charts. I find that to be extremely bullish and can’t understand why someone on Bloomberg doesn’t mention that!
If you look at the previous weekly chart you’ll see that in spite of the recent sell-off, gold didn’t even retrace 38.1% of its bull market move. Also, when you look at the chart it’s so clear the trend is up that a blind man could see it. Now I want to compare the recent decline to the previous decline to if we can learn anything:
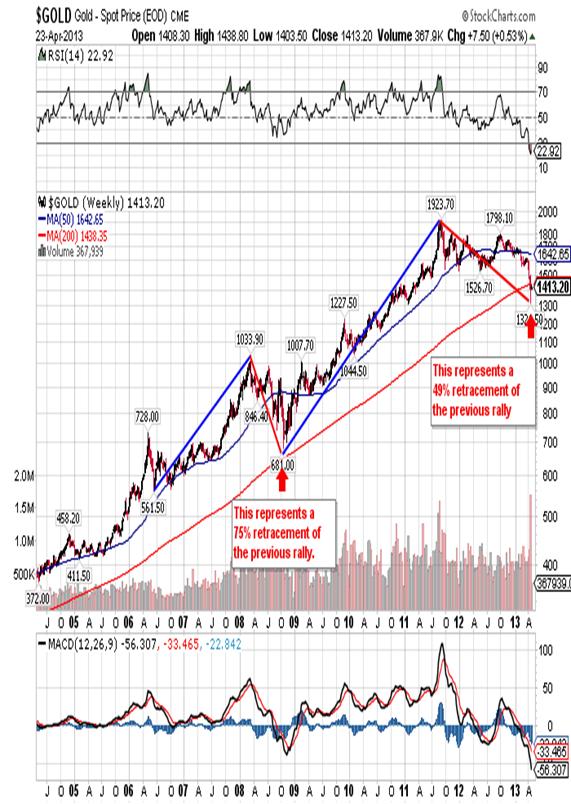
Comparatively speaking the recent decline was no where near the scope and magnitude of the decline the market experienced in 2008 and yet we’re at the funeral and they’re throwing dirt on the body! If you think back to 2008 you just might recall that every clown with an ax to grind was on TV telling us that gold is going back to $250. Of course gold went to 1,923, but you pays attention to those little details.
So with all that in mind I have to ask my self where gold is going now?
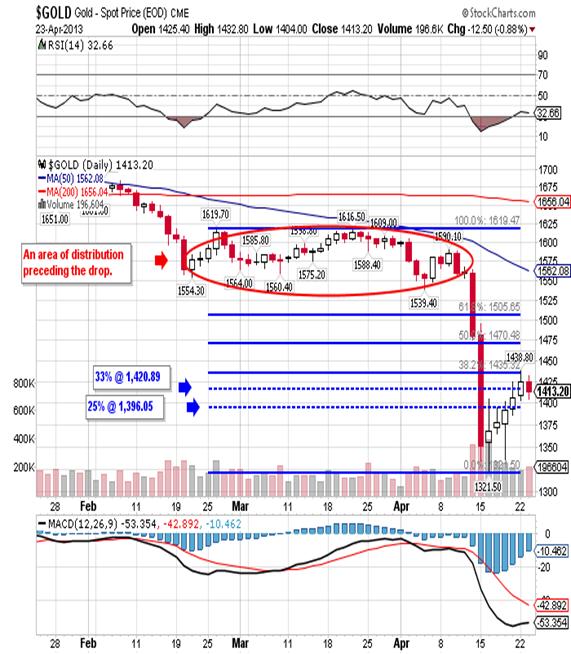
So far gold has surpassed the resistance from both a 25% retracement (1,396.05) and a 33% retracement (1,420.89), and this morning it tested the 38.1% resistance found at 1,435.32. The high so far this morning is 1,435.30. I believe it will continue to work its way higher and through the resistance found at 1,435.32 and again at 1,470.48, and on up to a test of a range of strong resistance found in the 1,505 to 1,522 area. More than likely it will need to do some work in that are with possibly a couple of sharp quick sell-offs that retrace 30.00 or so, with buyers then coming to take what no one else wants. In short, I am convinced the bottom is in and now we’re going higher, slowly at first with some fits along the way, but much higher.
In conclusion I look at the overnight buying of physical gold coming out of China, India and Russia and I see buyers willing to take all you want to sell at 1,350 to 1,375. Then we have the average cost of mining an ounce of gold at 1,325 providing a natural floor. Also, from a contrarian view I find it extremely bullish that everyone now hates gold! Perhaps the ace in the hole though is the fact that the global economy is slowing at a faster pace and all the major powers will be forced to increase QE to levels that no one would have thought possible just six months ago.
Finally, I can’t prove it but I have to believe the take down in the price of gold has a more sinister element to it. There is something out there that has the Fed scared and they felt obliged to force gold down to 1,322 and would have liked to push it down to 1,087, but the surge in physical demand stopped them before they could do it. Now they can’t push paper gold lower without creating a crisis of confidence, and that would expose them for the frauds that they are. That’s why I have no doubt that gold is going to new heights!
Robert M. Williams
St. Andrews Investments, LLC
Nevada, USA
Copyright © 2013 Robert M. Williams - All Rights Reserved Disclaimer: The above is a matter of opinion provided for general information purposes only and is not intended as investment advice. Information and analysis above are derived from sources and utilising methods believed to be reliable, but we cannot accept responsibility for any losses you may incur as a result of this analysis. Individuals should consult with their personal financial advisors.
Robert M. Williams Archive |
© 2005-2022 http://www.MarketOracle.co.uk - The Market Oracle is a FREE Daily Financial Markets Analysis & Forecasting online publication.