


Which Market Bubble is Larger - Stocks or U.S. Treasury Bonds
Stock-Markets / Liquidity Bubble Apr 26, 2013 - 01:58 PM GMTBy: J_W_Jones

 Today we have a plethora of companies reporting earnings and are moving through the 1st Quarter earnings season at a rapid pace. Thus far, earnings have been far from exciting and have made the previous 2013 forward earnings estimates laughable.
The only way we get to the proposed valuations is through multiple expansion which is simply going to require the Federal Reserve to continue to pump $85 billion into Treasury’s and MBS securities each month. I am confident they will comply.
There are a few analysts out there who are discussing the potential bubble forming in equities and other risk assets as Bernanke’s plan is working to the extent that asset prices are rising. However, even fewer analysts are pointing out that both retail and institutional money is constantly chasing yield at this point.
Simply take a look at the 2013 price action in high yield dividend paying stocks, high yield bonds, preferred stocks, and master limited partnerships. It is safe to say that a bubble has formed not just in equities, but in various fixed investments as well. Consider the following chart of the S&P 500 Index (SPX) shown as the dotted trendline and Johnson & Johnson (JNJ) shown as the solid black line.
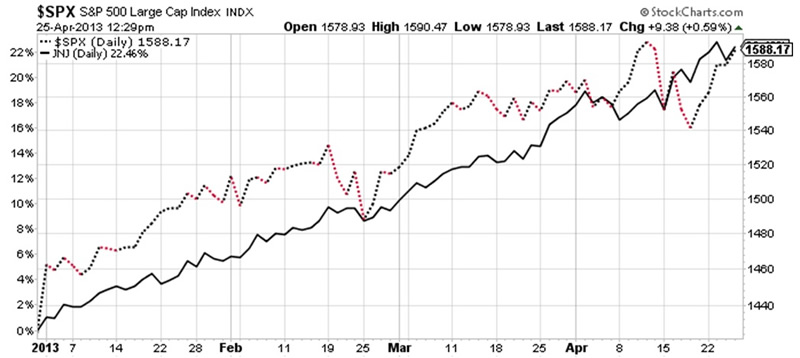
Obviously from looking at the chart above, JNJ has outperformed the S&P 500 Index year to date. Has JNJ suddenly become a growth giant? Is it all about earnings growth and/or forward earnings potential or anticipated growth?
Or is the rally in JNJ really about the fact that Johnson & Johnson has a long history of paying strong, rising dividends. I am sure there are plenty of sell side analysts who will tell you that JNJ is going to $100 / share in the future for a variety of macro or quantitative reasons.
The sell-side analysts will tell you the economy is strengthening or that large cap multinational companies are seeing strengthening fundamentals and earnings growth. They are called the sell-side for a reason; they want to sell you stock.
Furthermore, my favorite recent discussion is about future earnings projections and the new strength that we are going to see in earnings. The following chart was posted at www.zerohedge.com and originally came from Standard & Poors. The chart below illustrates the trailing 12 month operating earnings per share of S&P 500 companies.
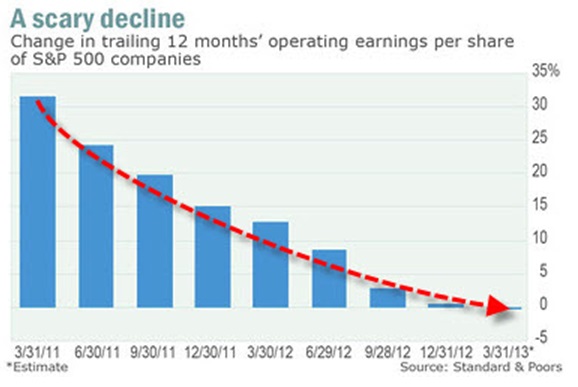
Based on the above data, how is the stock market fundamentally sound when earnings are collapsing? I guess the Federal Reserve is going to print profits for the S&P 500 companies. Actually earnings are irrelevant when central banks all over the world including the Federal Reserve are juicing the markets with a sea of liquidity and where multiple expansion trumps real earnings or value.
Furthermore, these same central banks are openly purchasing equities and allocating sizable portions of their balance sheets to stocks. Several central banks around the world have more than 10% of their reserves allocated to stocks at this point in time. The world is long risk and money is still flowing into bonds at the same time. Simply look at the recent price action in Treasury’s for the past few weeks or note the strength in municipal bonds in aggregate since mid-March.
This brings me to my final point. For the past several years, bonds and stocks in the United States have rallied together. U.S. treasuries and domestic equities have been trending higher for more than three years as shown below. The S&P 500 is shown as the dotted line and the 30 Year Treasury Bond Price Index is the black solid line.
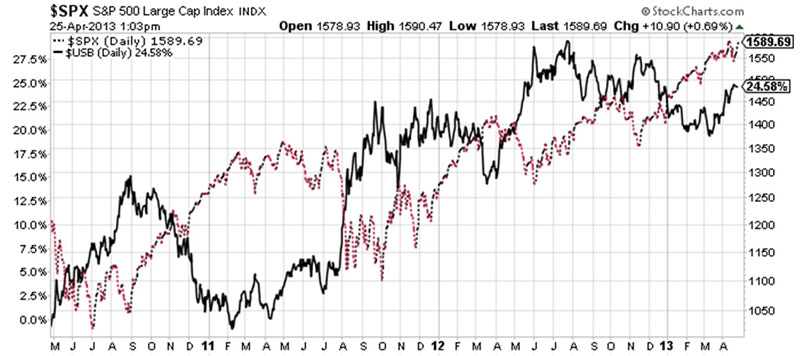
It is without question that both the S&P 500 Index and the 30 Year Treasury Bond have been trending higher for the past 3 years overall. Both underlying assets have produced strong gains during the same period of time. Now this brings me to my final question for readers to ponder. If both the S&P 500 Index and the 30 Year Treasury Bond can rally together, what happens if they selloff together?
The answer to that question is the real problem. Many sell-side analysts and economists ignore the bubble that the Federal Reserve has created in equity valuations. The bubble continues to be fueled by the monstrous liquidity injections that they have conducted beginning with the original quantitative easing. However, what is even less acknowledged by the sell-side is the massive artificial bullish valuations that have been created in the bond market.
Long dated treasuries are being purchased by the Federal Reserve to artificially hold down interest rates. This ongoing practice is causing a separate bubble to form in fixed income investments. So now we have a bubble in equities and long-dated treasuries forming and the sell-side continues to trumpet that higher prices are likely. Ultimately the sell-side may be right in short to intermediate time frame, but the end game has a finality that few want to consider.
When these bubbles finally pop as all excessively valued assets do, the result is going to devastate financial markets. It may be in 6 months or it may be in 10 years, but history will not be thwarted. The central banks can try to outsmart history, but they will ultimately fail.
Happy Option Trading!
Simple ONE Trade Per Week Trading Strategy?
EASTER 30% OFF SPECIAL
COUPON: EASTER30
Join www.OptionsTradingSignals.com today
JW Jones
J.W. Jones is an independent options trader using multiple forms of analysis to guide his option trading strategies. Jones has an extensive background in portfolio analysis and analytics as well as risk analysis. J.W. strives to reach traders that are missing opportunities trading options and commits to writing content which is not only educational, but entertaining as well. Regular readers will develop the knowledge and skills to trade options competently over time. Jones focuses on writing spreads in situations where risk is clearly defined and high potential returns can be realized.
This article is intended solely for information purposes. The opinions are those of the author only. Please conduct further research and consult your financial advisor before making any investment/trading decision. No responsibility can be accepted for losses that may result as a consequence of trading on the basis of this analysis.
J.W. Jones Archive |
© 2005-2022 http://www.MarketOracle.co.uk - The Market Oracle is a FREE Daily Financial Markets Analysis & Forecasting online publication.