Stock Market Don't Sell In May! Reasons Why to Extend Your Stay
Stock-Markets / Seasonal Trends May 07, 2013 - 10:22 AM GMTBy: Frank_Holmes
 During the first week of May every year, the maxim, "Sell in May and Go Away," gets taken out, dusted off and powered up as a reason to sell stocks. The rhyme is more than just a catchy urban legend: June, July, August and September have historically been the weakest months of the year for the S&P 500 Index.
Yet even if seasons trigger certain events, when the snow falls in Minnesota in May, Midwesterners need to throw on their winter gear and roll out snowblowers, not lawnmowers.
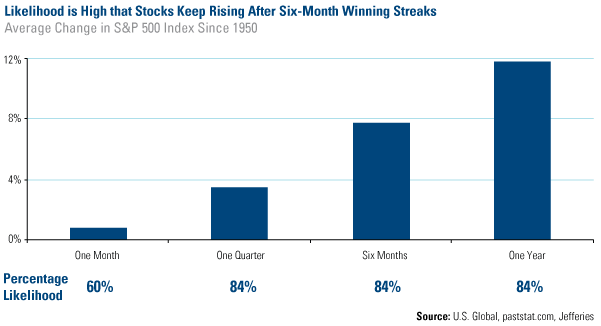
Consider this encouraging research: The S&P 500 has been rallying for six months in a row, which has happened 48 times since 1950. Following these six-month winning streaks, stocks have historically continued rising. Sixty percent of the time, the S&P 500 climbed 0.79 percent over the next month; 84 percent of the time, stocks increased 3.50 percent, 7.77 percent and 11.77 percent the next three, six and 12 months following the streak.

In addition, 165,000 jobs were added to payrolls in April, helping the unemployment rate fall to 7.5 percent. This is the lowest level since December 2008.
The news comes days after the Federal Reserve stamped its approval on another month of bond buying, with the added bonus of Ben Bernanke stating that the Fed is "prepared to increase or reduce the pace of its purchases to maintain appropriate policy accommodation."
If that's not enough to validate a continuing bull market, consider the European Central Bank's exceptional move this week. Mario Draghi cut key interest rates to 0.5 percent, the first time in 10 months, following weaker manufacturing data out of top four largest economies in the eurozone. Germany, France, Italy and Spain all experienced manufacturing contractions.
Our portfolio manager of the Emerging Europe Fund, Tim Steinle, described the ECB's motivation this way: It's one thing to punish the periphery; it's another to weaken the core.
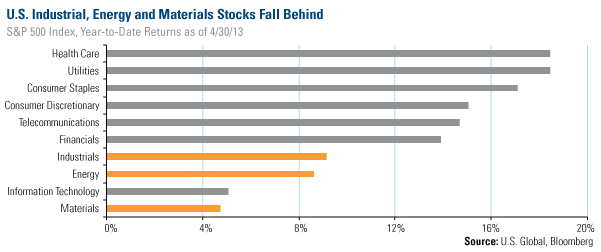
The S&P 500 has climbed an amazing 12.74 percent through April 30, so if you're eager to do some investment spring cleaning, you might want to consider areas that have underperformed. For example, take a look at the year-to-date returns by sector, which reveal an interesting pattern. Health care, utilities, consumer staples and consumer discretionary have all climbed more than 15 percent, much more than the market. Meanwhile, companies in the materials, energy and industrials sectors have lagged the overall index.

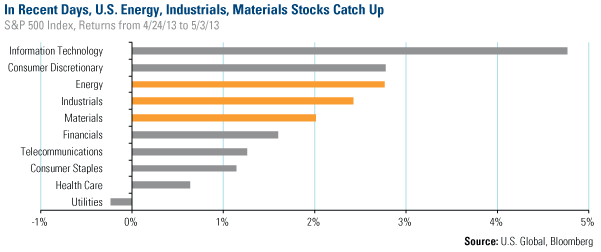
In recent days, an inflection point seems to have occurred, with these weaker areas of the market gaining strength. We wrote in the Investor Alert last week that cyclical stocks, including health care, consumer staples, utilities and telecommunication, have been lagging the remaining sectors. From the beginning of the earnings season on April 24 through May 3, energy, industrial and materials stocks are nearly the best performing areas of the market.

We believe expectations might have become too lofty for defensive companies and too gloomy for cyclical stocks, so as perceptions toward global growth improve, it won't take much for energy, industrials and materials to take off.
Also Read: A Case for Owning Commodities When No One Else Is
Spring Clean Your Treasury Portfolio Too
With the Fed's insistence to keep interest rates low, real interest rates remain negative for investors. For example, a 90-day T-bill yields 0.06 percent and 2-year Treasury yields 0.23 percent, but inflation burns off 1.5 percent.
It's interesting to note that while low interest rates help keep the government's debt payments low, these rates hurt seniors living on a fixed income. My friend, Terry Savage writes this week,
"Savers are the big losers in this rigged game. And most domestic savers are seniors and those approaching retirement, who planned to live on the income generated by their savings. Today, that's simply not possible - unless they are willing to take on a lot more risk."
Here's an alternative that offers both a shorter duration and higher yields, without a lot of risk: The Near-Term Tax Free Fund (NEARX) has a tax-equivalent yield of 1.51 percent as of March 31, 2013. Its 30-day SEC yield is 0.81 percent. These yields are significantly higher than a 2-year Treasury. Learn more today.
The important idea for investors is to adjust to the current conditions. Regardless of the month, if the thermostat shows frigid temperatures, dress accordingly. Likewise for when it's hot in the summer. What's important is to stay tuned and make sure your portfolio is dressed accordingly.
Don’t miss the presentation that received more than a quarter-million page views on businessinsider.com. To download your copy, go to www.usfunds.com, follow us on Twitter or like us on Facebook.
By Frank Holmes
CEO and Chief Investment Officer
U.S. Global Investors
U.S. Global Investors, Inc. is an investment management firm specializing in gold, natural resources, emerging markets and global infrastructure opportunities around the world. The company, headquartered in San Antonio, Texas, manages 13 no-load mutual funds in the U.S. Global Investors fund family, as well as funds for international clients.
All opinions expressed and data provided are subject to change without notice. Some of these opinions may not be appropriate to every investor.
Standard deviation is a measure of the dispersion of a set of data from its mean. The more spread apart the data, the higher the deviation. Standard deviation is also known as historical volatility. All opinions expressed and data provided are subject to change without notice. Some of these opinions may not be appropriate to every investor. The S&P 500 Stock Index is a widely recognized capitalization-weighted index of 500 common stock prices in U.S. companies. The NYSE Arca Gold BUGS (Basket of Unhedged Gold Stocks) Index (HUI) is a modified equal dollar weighted index of companies involved in gold mining. The HUI Index was designed to provide significant exposure to near term movements in gold prices by including companies that do not hedge their gold production beyond 1.5 years. The MSCI Emerging Markets Index is a free float-adjusted market capitalization index that is designed to measure equity market performance in the global emerging markets. The U.S. Trade Weighted Dollar Index provides a general indication of the international value of the U.S. dollar.
Frank Holmes Archive |
© 2005-2022 http://www.MarketOracle.co.uk - The Market Oracle is a FREE Daily Financial Markets Analysis & Forecasting online publication.


