


Silver Bull Market Following Structure Of 1970's Bull Market
Commodities / Gold and Silver 2013 May 09, 2013 - 02:50 PM GMTBy: Hubert_Moolman

 The 70s silver bull took place during a period from a major peak in the Dow/Gold ratio (1966) to a major bottom in Dow/Gold ratio (1980). The silver bull market started in 1971 and ended at the beginning of 1980.
The current silver bull market also started after a major peak in the Dow/Gold ratio (peak was at the end of 1999).The current silver bull market started in 2001, and it is also likely to end when the Dow/Gold ratio makes a major bottom. See the chart below, as illustration:
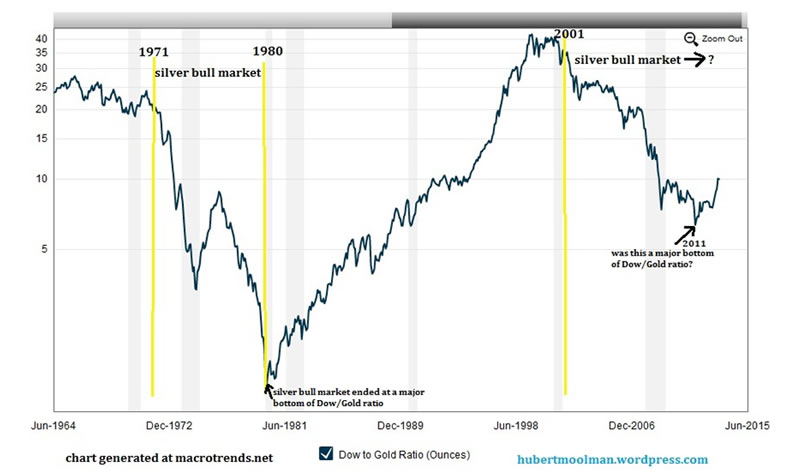
In 2011, silver peaked at the $50 level, while in the same year, the Dow/Gold ratio made a bottom just lower than the 5.75 level. Was that the end of the silver bull market? Will the Dow go on to make highs that are multiples higher than the current high, while the silver price collapses?
The major problem with saying that the silver bull market is over, is the fact that the price has not even surpassed the high of the previous bull market. One can only begin to consider the possibility that the silver bull market is over when the price has gone a few multiples higher than the 1980 price of $50.
Until then, we look for a bottom in the silver price, and the next wave higher in this bull market. Instead, consider the Dow as a peaking bull market, with it being multiples higher than its 1973 high (the high of the previous major bull market).
Comparison of the current and 70s silver bull market
On the graphic below, the top chart is the silver bull market of the 70s, compared to the current bull market of the 70s (the bottom chart).
I have tried to line the two charts up; starting from both peaks in the Dow/Gold ratio (it is not exact, but close enough). The two bull markets are definitely following a similar pattern to some degree.
Notice that the first major peak in the 70s bull market came about eight years after the peak in the Dow/Gold ratio. The 2008 peak in the silver price was also about eight years since the peak in the Dow/Gold ratio.
During the 70s, the peak after eight years appears to have been a significant level, since price really accelerated higher, after clearing that peak. Price also accelerated higher when it cleared the 2008 peak, in 2010. The difference this time is the fact that currently we are having a retest of that peak level (which is not necessarily a bad thing).
If price does not go too far below the 2008 peak level ($21), then we have a very bullish looking pattern. The current retest of the 2008 peak level could mean that if we eventually find that bottom, and go higher, we are unlikely to ever see these levels again.
The comparison seems to suggest that the rally we had from August 2010 to April 2011, is just a prelude to the coming major rally. If the current bull market pattern continues to follow the 70s pattern, then we could have a peak in the price of silver when the Dow/Gold ratio bottoms.
We cannot be sure when this will happen, but should it be about 14 years after the peak in the Dow/Gold ratio, like it was during the previous bull market, then we could have a peak in silver at the end of 2013 to the beginning of 2014.
If the current bull market structure continues to follow the basic structure of the 70s bull market, then price should, at least, clear $140.
For more silver and gold analysis and guidance, see my Long-term Silver Fractal Report or subscribe to my Premium Service.
Warm regards and God bless,
Hubert
http://hubertmoolman.wordpress.com/
You can email any comments to hubert@hgmandassociates.co.za
© 2013 Copyright Hubert Moolman - All Rights Reserved
Disclaimer: The above is a matter of opinion provided for general information purposes only and is not intended as investment advice. Information and analysis above are derived from sources and utilising methods believed to be reliable, but we cannot accept responsibility for any losses you may incur as a result of this analysis. Individuals should consult with their personal financial advisors.
© 2005-2022 http://www.MarketOracle.co.uk - The Market Oracle is a FREE Daily Financial Markets Analysis & Forecasting online publication.