


Margin Debt and the Next Stock Market Crash
Stock-Markets / Financial Crash May 10, 2013 - 06:36 PM GMTBy: Clif_Droke

 The latest fear on Wall Street is that record levels of margin debt may end up toppling the stock market rally.
NYSE margin debt recently reached its highest level since 2007 before the last major stock market peak and credit crash. Stephen Suttmeier, technical research analyst at Bank of America, noted that margin debt, rose 28% in March from a year ago to $380 billion. That figure is slightly below the July 2007 peak of $381 billion, although analysts speculate that April's margin debt totals (which haven't yet been released) have already surpassed this mark.
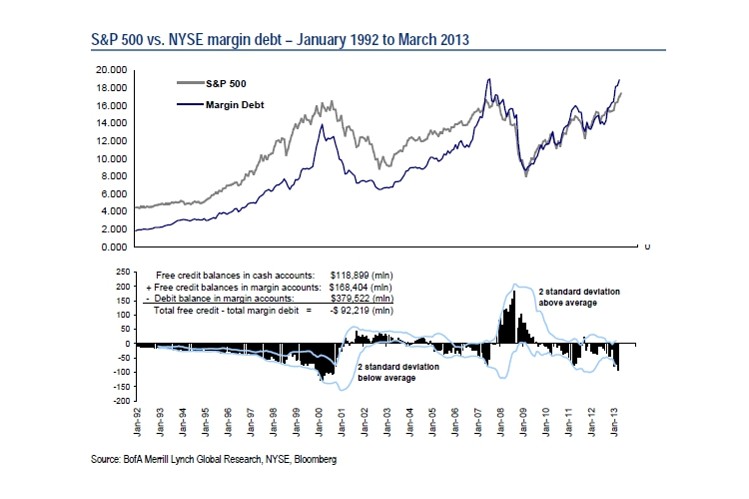
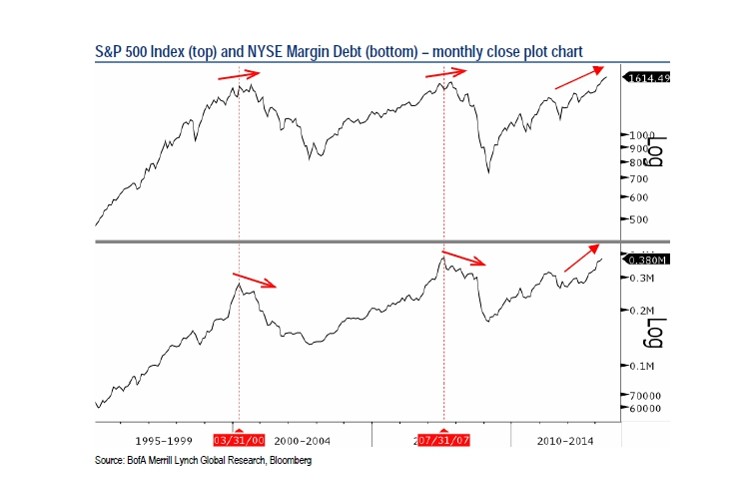
Suttmeier told The Wall Street Journal that the currently high margin debt levels are "contrarian bearish." While high margin levels have coincided with major market tops of the past, there's an important twist to this particular indicator. In order to confirm that a top has been made, margin debt levels normally turn down before major indices like the S&P 500 peak. See the following graph, courtesy BoA Merrill Lynch.
"It's no surprise people have been taking on more risk as the market has moved to record highs," writes Steven Russolillo in The Wall Street Journal. "But the question is what happens when the easy ride higher turns south and some of that margin debt turns into margin calls?" The article goes on to warn of a potential selling wave if stock prices reverse and margin calls lead to mass liquidation. "A wave of margin calls can worsen selling pressure on stocks and was seen as partly to blame for the market's woes during the financial crisis," writes Russolillo.
While it's true that rising margin debt levels should be viewed as a potential yellow flag for the stock market, other indicators don't yet suggest the rally has reached bubble proportions. As economist Ed Yardeni pointed out in a recent blog (http://blog.yardeni.com), "Valuation multiples aren't flashing irrational exuberance yet, but that could change quickly in a debt-financed melt-up of stock prices."
Yardeni suggests that while NYSE margin requirements have been unchanged since January 1974, Fed Chairman Bernanke could boost the requirement later this year in response to charges that the Fed's stimulus program is leading to a stock market bubble.
Lest investors forget, margin requirement hikes can take a huge toll on investor psychology and can completely take the wind out of a market's sails. Remember the gold and silver margin increases of 2011, anyone?
Gold
The price of gold was last quoted at $1,422 (basis June futures) after slipping on May 10. After a decent short covering rally since bottoming in mid-April, gold has encountered resistance at the overhead 30-day moving average intersection at the $1,478 level.
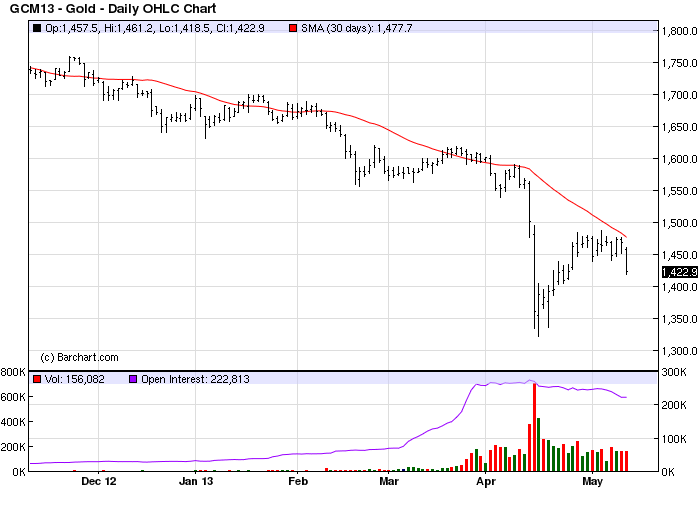
The all-important test of support following the April bottom is likely underway. This is normal following a major bottom and recoil rally like we've seen in the gold market in recent weeks. After the initial rally it's common for price to test the previous low - either by making a higher low, a double bottom or, if worse comes to worse, a lower low. The current pullback and test of support over the next few days will be very revealing as to just how strong and serious the buyers really are.
One reason I haven't recommended long positions in gold yet despite the recent close above the 15-day MA is the fact that gold's relative strength line still hasn't broken its downward trend. Currently the relative strength line for the gold ETF (IAU) is testing the recent lows in a sign of relative weakness. Relative strength (RS) isn't an infallible indicator for gauging the upside or downside potential of gold but at the same time it's not something to be ignored. As discussed in the previous report, an upward reversal of the RS line from here would be a welcome change of gold's internal condition and would give us greater confidence in gold's internal strength going forward.
2014: America's Date With Destiny
Take a journey into the future with me as we discover what the future may unfold in the fateful period leading up to - and following - the 120-year cycle bottom in late 2014.
Picking up where I left off in my previous work, The Stock Market Cycles, I expand on the Kress cycle narrative and explain how the 120-year Mega cycle influences the market, the economy and other aspects of American life and culture. My latest book, 2014: America's Date With Destiny, examines the most vital issues facing America and the global economy in the 2-3 years ahead.
The new book explains that the credit crisis of 2008 was merely the prelude in an intensifying global credit storm. If the basis for my prediction continue true to form - namely the long-term Kress cycles - the worst part of the crisis lies ahead in the year 2014. The book is now available for sale at: http://www.clifdroke.com/books/destiny.html
Order today to receive your autographed copy and a FREE 1-month trial subscription to the Gold & Silver Stock Report newsletter.
By Clif Droke
www.clifdroke.com
Clif Droke is the editor of the daily Gold & Silver Stock Report. Published daily since 2002, the report provides forecasts and analysis of the leading gold, silver, uranium and energy stocks from a short-term technical standpoint. He is also the author of numerous books, including 'How to Read Chart Patterns for Greater Profits.' For more information visit www.clifdroke.com
Clif Droke Archive |
© 2005-2022 http://www.MarketOracle.co.uk - The Market Oracle is a FREE Daily Financial Markets Analysis & Forecasting online publication.