


Stock Market Correction Near But Bull Market Has Further to Run
Stock-Markets / Stock Markets 2013 May 11, 2013 - 06:23 PM GMTBy: David_Banister

The SP 500 has been on a tear as we all know especially since the SP 500 bottomed at 1343 several months ago. My work centers around forecasting using Elliott Wave Theory along with other technical indicators. This helps with projecting the short, intermediate, and longer term paths in the stock market and also precious metals. This larger picture Bull Cycle started in March of 2009 interestingly after an exact 61.8% Fibonacci retracement of the entire move from 1974 to 2000 lows to highs. At 666, we had completed a major cycle bottom with about 9 years of movement to retrace 26 years of overall bull cycle. That was a major set of 3 waves (Corrective patterns in Elliott Wave Theory) from the 2000 highs to 2002-3 lows, then 2007 highs to 2009 lows. Once that completed its work, we were free to have a huge new bull market cycle off extreme sentiment and generational lows.
It’s important to understand where we were at in March of 2009 just as much as it is today with the market at all-time highs. Is this the time to bail out of stocks or do we have a lot more upside yet to go? Our short answer is there is quite a bit more upside left in the indexes, but there are multiple patterns that must take place along the way. We will try to lay those out for you here as best we can.
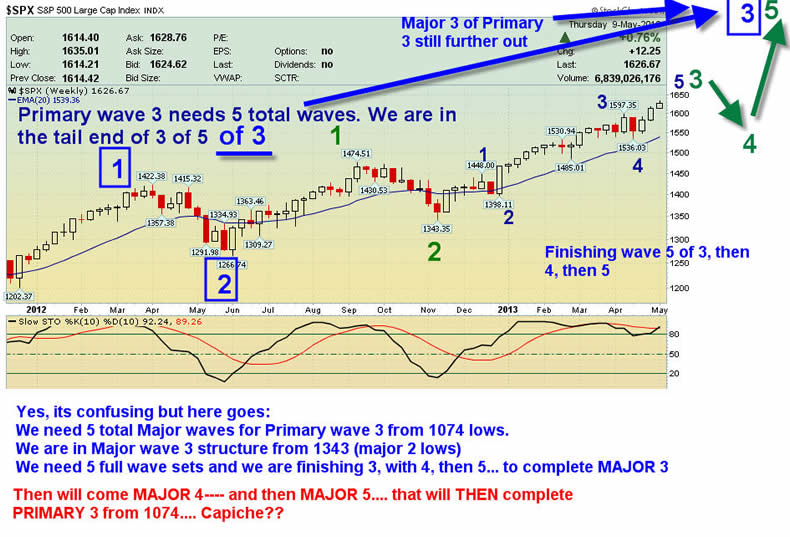
Elliott Wave theory in general calls for 5 full wave cycles in a Bull pattern, with 1, 3, and 5 bullish and 2 and 4 corrective. We are currently in what is often the most bullish of all the patterns, a 3rd of a 3rd of a 3rd. In English, we are in Primary wave 3 of this bull cycle which will be 5 total primary waves. We are in Major wave 3 of that Primary 3, and in the Intermediate wave 3 of Major wave 3. That is why the market continues its relentless climb. This primary wave 3 still has lots of work to do because Major wave 3 still has a 4th wave down and a 5th wave up to finish, then we need a major 4, then a major 5. That will complete primary wave 3. This will then be followed by a Primary wave 4 cycle correction that probably lasts several months, and then a Primary wave 5 cycle to finish this part of the bull market from March 2009 generational lows… and all of that work is going to take time. Once that entire process from March 2009 has completed, then we should see a much deeper and uglier correction pattern, but we think that is at least 12 months or more away.
What everyone wants to know then is where are we at right now and what are some likely areas for pivot highs and lows ahead? We should complete this 3rd of a 3rd of a 3rd here shortly and have a wave 4 correction working off what will likely be almost 300 points of upside from SP 500 1343. We could see as much as 90-120 points of correction in the major index once this wave completes. Loosely we see 1528-1534 as a possible top and if not then maybe another 30 or so points above that maximum into early June. This should then trigger that 90-120 point correction, and then be followed by yet another run to highs.
We could go on but then we will lose our readers here for sure, and as it is… this is all projections and postulations, so it’s best to keep the forecast to the next many weeks or few months. Below is a chart we have put together showing the structure of Major wave 3 of Primary 3 since the 1343 lows. Once that Major wave 3 tops out (see the blue 3) then we will have Major 4, then Major 5 to complete Primary wave 3 since the 1074 SP 500 lows. Whew!
Consider joining us at www.MarketTrendForecast.com for occasional free reports and or a 33% discount to join and get regularly daily forecast updates on the markets and precious metals that are outside the box.
Dave Banister
CIO-Founder
Active Trading Partners, LLC
www.ActiveTradingPartners.com
TheMarketTrendForecast.com
Dave Banister is the Chief Investment Strategist and commentator for ActiveTradingPartners.com. David has written numerous market forecast articles on various sites (MarketOracle.co.uk, 321Gold.com, Gold-Eagle.com, TheStreet.Com etc. ) that have proven to be extremely accurate at major junctures.
© 2013 Copyright Dave Banister- All Rights Reserved
Disclaimer: The above is a matter of opinion provided for general information purposes only and is not intended as investment advice. Information and analysis above are derived from sources and utilising methods believed to be reliable, but we cannot accept responsibility for any losses you may incur as a result of this analysis. Individuals should consult with their personal financial advisors.
© 2005-2022 http://www.MarketOracle.co.uk - The Market Oracle is a FREE Daily Financial Markets Analysis & Forecasting online publication.