The Big Fallacy Silver Trading More Like A Base Metal
Commodities / Gold and Silver 2013 May 13, 2013 - 10:28 AM GMTBy: Steve_St_Angelo
 The notion that silver has been recently trading more like a base metal is more a fallacy than fact. Some of the top technical analysts have been stating that the reason why the price of silver has not held up as well as gold is due to the fact that silver trades more like copper than gold. Basically, if the "King" of the base metals suffers... so will silver. While this makes good press, the reality is much different if we look at the data below.
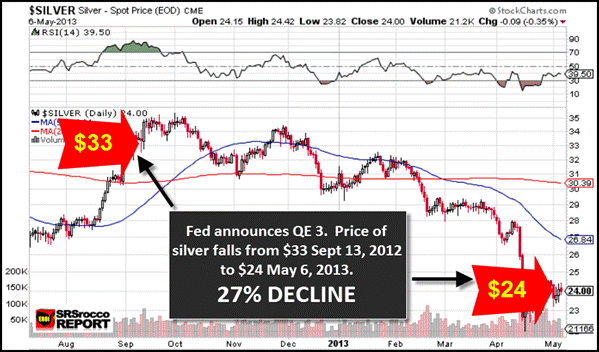
Below is a one year chart of the price of silver:

Here we can see that when the FED announced QE3 on Sept 13, the price of silver was $33, but by May 6, 2013, the price had fallen to $24. This was a 27% decline in 9 months. Gold fell from $1,700 to $1,450 in the same time period (14% decline).
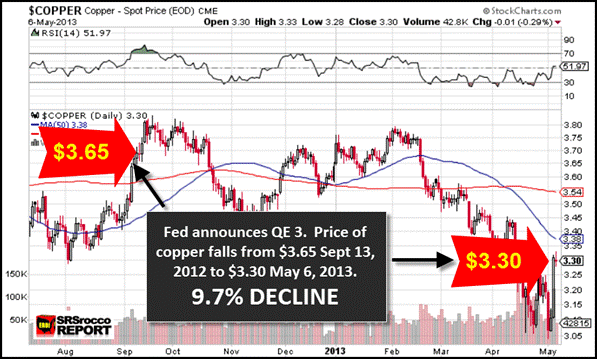
Now, if we take a look at how the price of copper reacted since the QE3 announcement, we see a much different story:

You will notice in the chart above, that the price of copper fell from $3.65 in Sept 13, 2012 to $3.30 on May 6, 2013. Thus, the king of base metals only declined a measly 9.7% during the same period that silver fell 27%. Analysts who say that silver is performing like copper fail to comprehend that silver is actually getting clobbered a great deal more than copper.
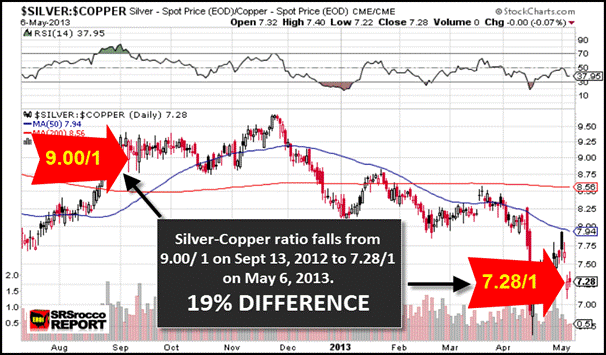
We can clearly see this in the next chart that shows the Silver-Copper Ratio:

After the FED QE3 announcement, the market could purchase 9 pounds of copper for every ounce of silver, however today the ratio has fallen to 7.28 to 1. As the silver-copper ratio falls, copper becomes more expensive compared to silver.
So the question remains... how is silver trading like copper if the price of silver has declined nearly 3 times that of copper in percentage terms in the past nine months? Well, some analysts may point to the fact that COMEX Silver warehouse stocks have increased a great deal since Sept. 2012.
Indeed they have...
COMEX SILVER INVENTORIES
SEPT 2012 = 138 million oz (approx)
MAY 2013 = 165 million oz
In the past nine months the COMEX has increased its Registered and Eligible silver inventories 20% at approximately 27 million ounces. Well, there you have it. The reason why silver has severely underperformed copper is due to a build in COMEX silver inventories.
Or is it?
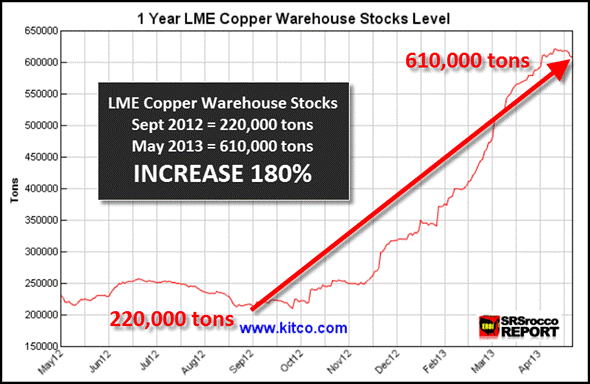
If we take a look at the next chart, you will see just how much copper inventories have grown compared to silver:

According to the LME (shown by Kitco), its copper warehouse stocks have increased from 220,000 tons in Sept 2012 to 610,000 tons in May 2013. Thus, the LME added approximately 400,000 tons of copper or an increase of a 180% during this time period, while Comex silver inventories increased only 20%. Not only did copper beat silver in this race in adding warehouse stocks -- it did so by nearly 10 times the rate.
Even though the LME-LBMA do not provide easy access to public data on its silver warehouse stocks, I would imagine the percent increase would be similar to what took place on the COMEX. If this is true, then:
1) the difference in inventory builds are not reflective in market price, or
2) something fishy is taking place in the silver paper markets
Lastly, if we look at some of the changes in the following commodity prices, we can see a similar disconnect:
SEPT 2012 - MAY 2013 Price Changes
WTI CRUDE = -2%
COPPER = -10%
LEAD = -12%
ZINC = -12%
GOLD = -14%
SILVER = -27%
Not only is silver underperforming copper by a wide margin, it has also declined substantially against its two base metal cousins -- zinc & lead. Furthermore, the price of West Texas Crude dropped from approximately $97 a barrel on Sept 13, 2012, to $95.5 presently... a paltry 2% decrease.
Again, how can silver be trading like copper or other base metals if its price is behaving much worse? It's quite simple. Silver like gold, also behaves like a monetary metal. This recent takedown in the price of gold and silver was not by accident. Gold was down 14% during this time period and silver 27%. Normally, the price of silver falls more violently than gold during a rapid decline. So it is clear in my book that the price of silver is behaving more like a manipulated monetary metal than a base metal such as copper.
Ask yourself this question? How many investors were buying up copper, zinc and lead when the price of silver fell 18% in two days in April? Zero. Investors were buying record amounts of gold and silver during this past takedown because they are in fact... monetary metals.
When the public realizes the true value of the monetary metals, it will be too late for them. Indeed this will be the greatest irony of all time -- massive demand with no available supply.
Announcement... for all of those who have been reading my articles on Market Oracle, I now have a website called the SRSrocco Report, a blog where I will be publishing updated information on the precious metals, mining companies, ore grades, energy, the EROI, the economy and other important news.
In the near future, I also plan to offer a paid membership service that will provide monthly reports as well as quarterly updates on the miners as it pertains to ore grades, estimated break-even, financial metrics, energy consumption, and other analysis.
© 2013 Copyright Steve St .Angelo - All Rights Reserved Disclaimer: The above is a matter of opinion provided for general information purposes only and is not intended as investment advice. Information and analysis above are derived from sources and utilising methods believed to be reliable, but we cannot accept responsibility for any losses you may incur as a result of this analysis. Individuals should consult with their personal financial advisors.
© 2005-2022 http://www.MarketOracle.co.uk - The Market Oracle is a FREE Daily Financial Markets Analysis & Forecasting online publication.


