


Commodities Bear Market Elliott Wave Analysis
Commodities / Commodities Trading May 20, 2013 - 10:24 AM GMTBy: EWI

 We have written about the commodity market over the years, and have been generally bearish for quite some time. The typical commodity bull market lasts about 13 years, followed by about a 21 year bear market. This is the 34-year cycle. Commodity bull markets usually begin near the beginning of stock market Secular inflation/deflation cycles. Then end just before these cycles end. During the stock market Secular growth cycles commodities remain in a longer term bear market.
Some historical examples:
1929-1949 Secular deflationary cycle … commodity bull market 1933-1946.
1966-1982 Secular inflationary cycle … commodity bull market 1968-1980.
2000-2016? Secular deflationary cycle … commodity bull market 1999-2011.
In years past the CRB index was used to determine the overall trend of commodities. In recent years this has been replaced by the world consumption oriented GTX index. Notice the bull market in the GTX started in 1999, but ended in 2008. Other sectors within this index, there are five, started/ended at different times. The barometer we use to determine the beginning/end of the commodity bull/bear markets is Gold.
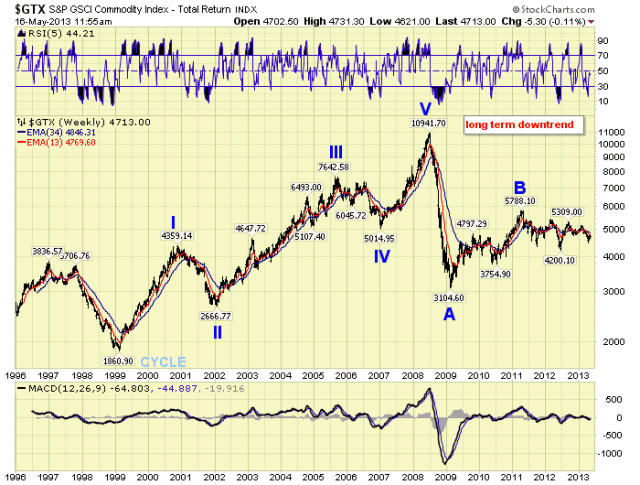
As you can observe from the above chart, the consumption bull market started in 1999, completed five waves up into 2008, and the long term trend has been down since 2008. Keep in mind the GTX is about 70% weighted in Energy.
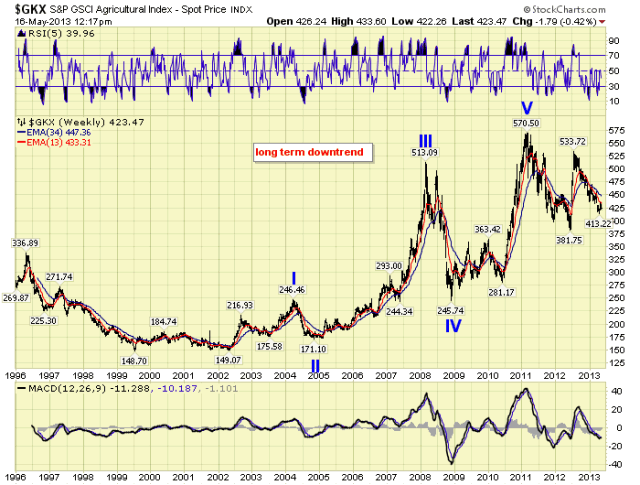
Other sectors, such as Industrial metals, Agriculture, and Precious metals started about the same time but topped in 2011. Livestock, the fifth sector, recently peaked in 2013.
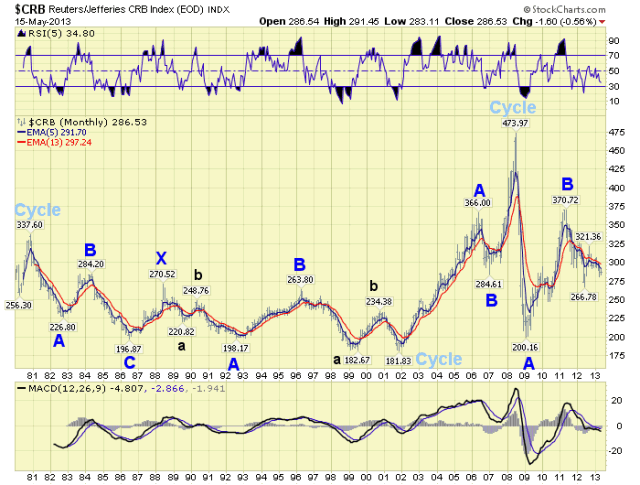
Now that commodities are in a longer term bear market, this is what lies ahead for this asset class. The best example of a commodity bear market is the historical price activity in the CRB index. Notice the sharp decline from the 1980 peak was an ABC down, which lasted about 6 years. Then the index went into a trading range for the next 15 years before the next Cyclical bull market began.
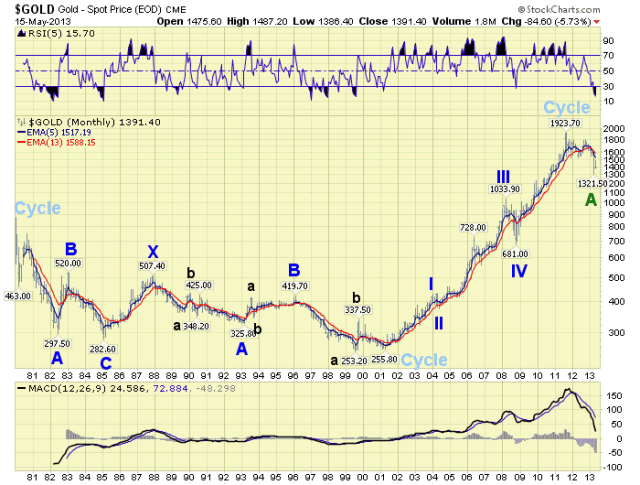
When we review the historical chart of Gold, using the same time period, we observe a slight difference in time, but the same general pattern. Gold declined sharply, in an ABC pattern, for 5 years. Then entered a trading range for the next 14 years, before it put in that double bottom in 1999-2001.
If we dissect the 1980 bear market in Gold, we observe a two year decline of about $575 to form Primary A. Then a one year $225 rally for Primary B. This is followed by another two year decline. But this time it is only $240, to a slightly lower low, to form Primary C.
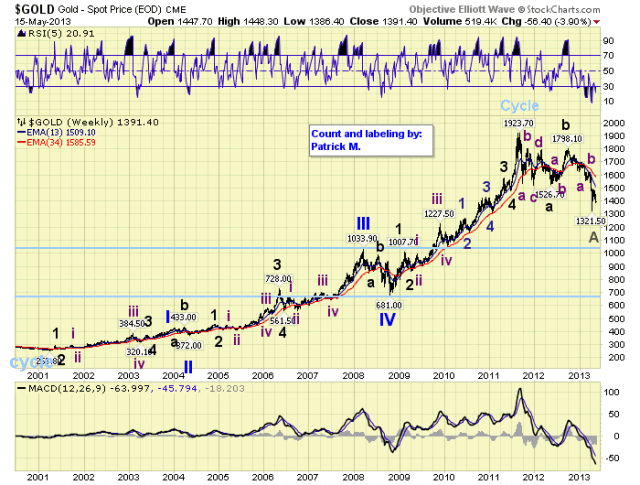
When we compare this activity to the current market, we find the bull market peak in 2011. Then a $600 two year decline that may have formed Primary A. If this comparison is correct, Gold should rally back to around $1545 by early next year to complete Primary B. Then the next two year Primary C decline should begin.
Keep in mind, commodities in general are quite volatile. Gold, in fact, has started to trade like Crude since it entered a bear market. One, two, three percent swings are possible in a single day.
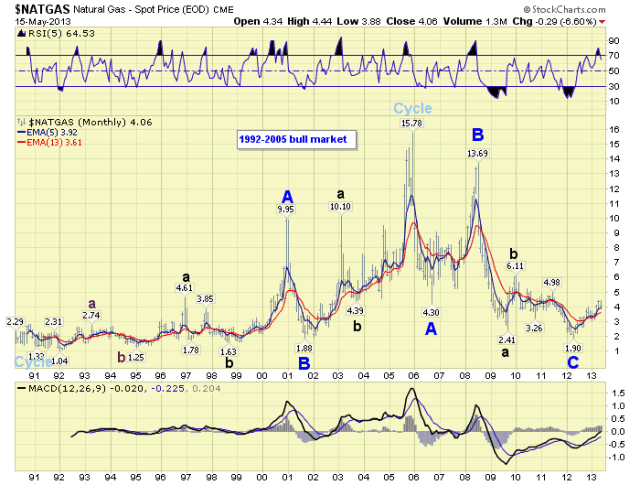
The last chart of note is Natural Gas. While we do not have much historical data we already notice a pattern. Nat Gas bottomed in 1992, then went into a choppy 13 year bull market until it had a blow off peak in 2005. Since that peak it has had a lengthy 7 year ABC decline into 2012. This fits with Gold’s 5 year ABC, and the CRB’s 6 year ABC in the 1980′s bear market.
This comparison would suggest Nat Gas is now in an X wave rally, which starts the trading range of its longer term bear market. Therefore, just under $2.00 would be the base price for decades to come. This chart also suggests Nat Gas will likely be the first commodity to end its bear market. Possibly as much as 6 to 8 years ahead of the other commodities. With lots of supply coming on line in the next few years. An earlier bottom in Nat Gas would fit quite nicely with the demand/economic growth curve of the expected stock market Cycle wave [3]: approximately 2016-2034. The pieces, if we dare look that far out, seem to fit.
CHARTS: http://stockcharts.com/...
http://caldaroew.spaces.live.com
After about 40 years of investing in the markets one learns that the markets are constantly changing, not only in price, but in what drives the markets. In the 1960s, the Nifty Fifty were the leaders of the stock market. In the 1970s, stock selection using Technical Analysis was important, as the market stayed with a trading range for the entire decade. In the 1980s, the market finally broke out of it doldrums, as the DOW broke through 1100 in 1982, and launched the greatest bull market on record.
Sharing is an important aspect of a life. Over 100 people have joined our group, from all walks of life, covering twenty three countries across the globe. It's been the most fun I have ever had in the market. Sharing uncommon knowledge, with investors. In hope of aiding them in finding their financial independence.
Copyright © 2013 Tony Caldaro - All Rights Reserved Disclaimer: The above is a matter of opinion provided for general information purposes only and is not intended as investment advice. Information and analysis above are derived from sources and utilising methods believed to be reliable, but we cannot accept responsibility for any losses you may incur as a result of this analysis. Individuals should consult with their personal financial advisors.
Tony Caldaro Archive |
© 2005-2022 http://www.MarketOracle.co.uk - The Market Oracle is a FREE Daily Financial Markets Analysis & Forecasting online publication.