


Silver More Weakness Before Price Takes off Higher Again
Commodities / Gold and Silver 2013 May 20, 2013 - 12:29 PM GMTBy: Clive_Maund

 Much of what is written about the macro factors affecting gold applies equally to silver, and will not be repeated here.
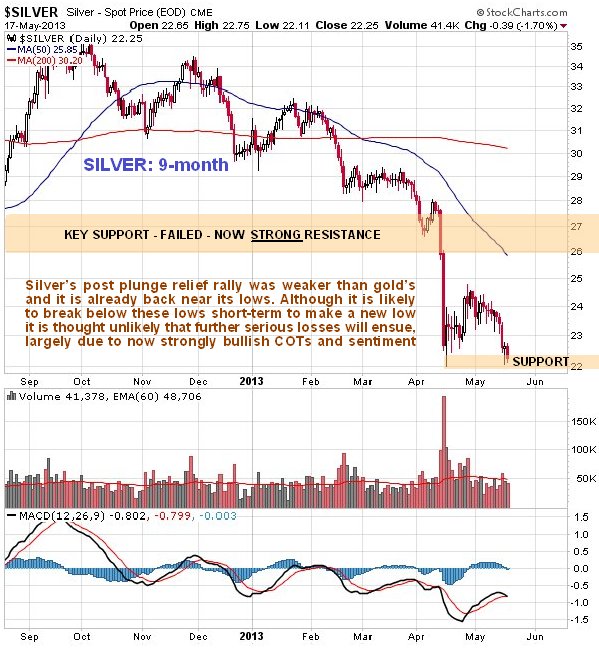
Silver's post plunge relief rally was considerably weaker and more stunted than gold's, and with it now back near to its April plunge lows after the drop last week, the chances are considered high that it will break to new lows soon. That said, its latest COTs and sentiment indicators are now strongly bullish, so that although it may well break to lower lows soon, it is thought unlikely that there will be much downside follow through before it hits bottom. We can see all this on its 9-month chart below, and how it is clinging on by its fingernails to the support at the April lows. Before leaving this chart, notice the large gap between the price and the 200-day moving average, which just by itself is a positive factor.
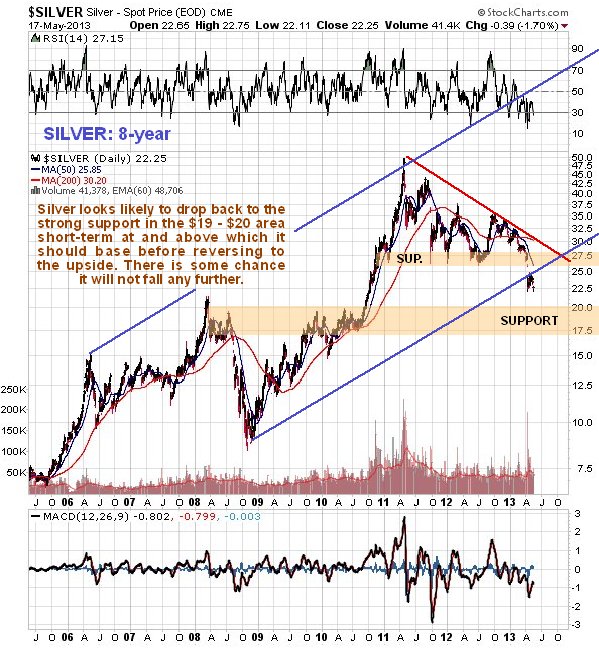
On its 8-year chart silver looks to have broken down on high volume from the long-term uptrend shown, although this uptrend is rather loose and undefined. By itself this is clearly not a favorable development, but it is countered by the now strongly bullish COTs and sentiment indicators which suggest that an important bottom is close at hand. This is why it is considered probable that, although some further short-term weakness is likely, the price will bottom near the strong support shown in the $19 - $20 area (this strong support continues down to about $17) in coming weeks.
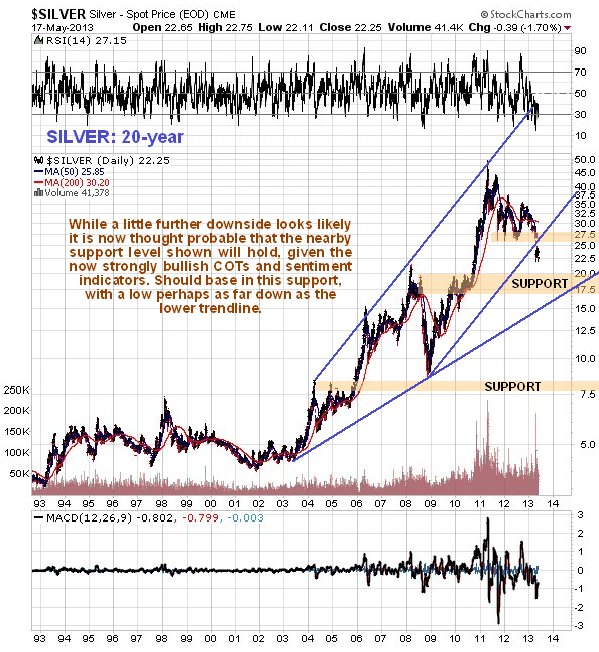
The long-term 20-year chart shows that the important and strong support in the $17 - $20 area is underpinned by a long-term uptrend line.
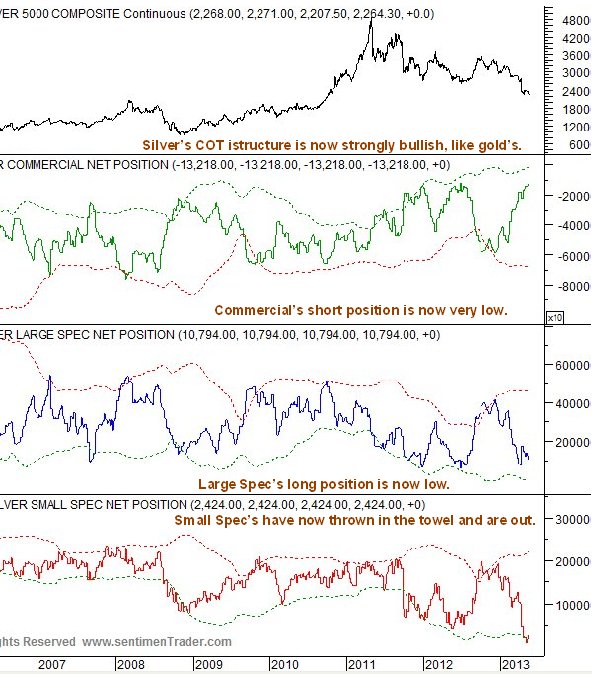
The latest silver COT chart is at its most bullish for a very long time, with Commercial short and Large Spec long positions at a very low level.
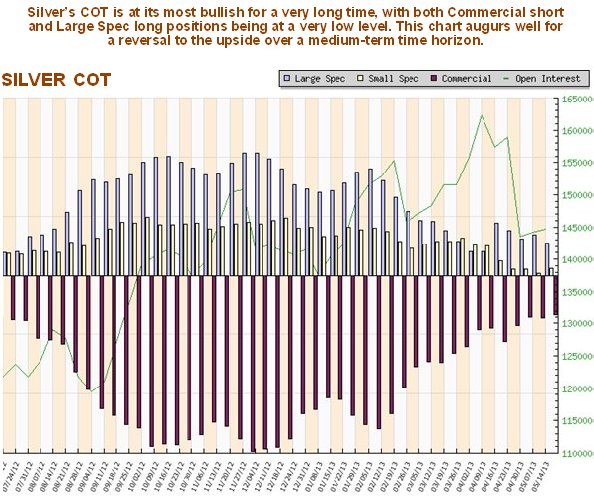
The longer-term COT chart shown below gives added perspective and suggests that silver is close to bottoming here.
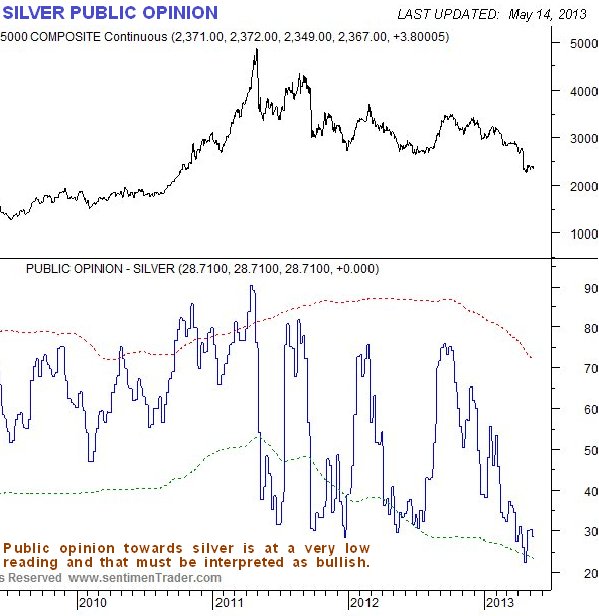
The Public Opinion chart for silver below shows that bullishness towards silver is close to its lowest levels in recent years, which is another contrarian bullish indication.
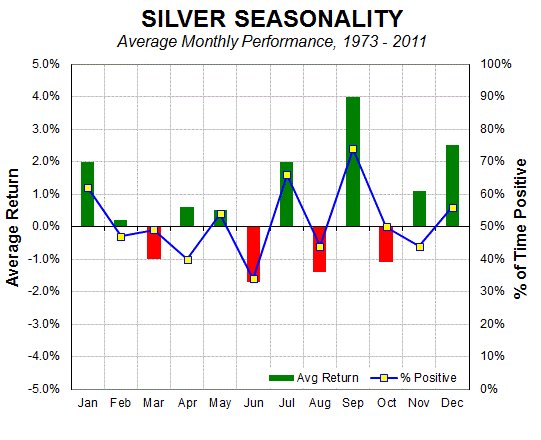
Finally, seasonals for silver are negative in June, but swing back to positive in July. By itself the seasonal chart below points to short-term weakness followed by a low and basing action before the price takes off higher again.
By Clive Maund
CliveMaund.com
For billing & subscription questions: subscriptions@clivemaund.com
© 2013 Clive Maund - The above represents the opinion and analysis of Mr. Maund, based on data available to him, at the time of writing. Mr. Maunds opinions are his own, and are not a recommendation or an offer to buy or sell securities. No responsibility can be accepted for losses that may result as a consequence of trading on the basis of this analysis.
Mr. Maund is an independent analyst who receives no compensation of any kind from any groups, individuals or corporations mentioned in his reports. As trading and investing in any financial markets may involve serious risk of loss, Mr. Maund recommends that you consult with a qualified investment advisor, one licensed by appropriate regulatory agencies in your legal jurisdiction and do your own due diligence and research when making any kind of a transaction with financial ramifications.
Clive Maund Archive |
© 2005-2022 http://www.MarketOracle.co.uk - The Market Oracle is a FREE Daily Financial Markets Analysis & Forecasting online publication.