Gold And Silver Markets Provide Us The Best Information
Commodities / Gold and Silver 2013 May 26, 2013 - 05:38 PM GMTBy: Michael_Noonan
 We cannot control the markets, but we can control how to respond to what they are saying. The paper market has been turned into a circus, thanks to JP Morgan, and abetted by the exchanges, COMEX and LME. Focus has to remain on the physical market, for it is where one can expect to find true value for price. What everyone has learned is that as price has declined, demand has disproportionately skyrocketed.
We have written extensively on the acquisition of physical gold and silver, regardless of price, because no one can know when the central bankers will lose control and price will erupt like Eyjafjallajökull. The world is in the middle of a huge central bank bubble, of which there are many sub-bubbles, as it were. [Anyone who pretends to believe whatever information is being disseminated by NWO-owned mainstream media, none of which makes any economic sense, and those who do not fully believe, (or at all), what is being said but do not know where else to turn, stay away from all central banks and central planners news or information.]
In addition to creating bubbles that will fail, the Western central bankers, and their puppet governments, are also doing battle with Eastern countries, mostly BRICS, but more and more countries are aligning with them and against the impending demise of fiat regimes. Western central banks are on the losing end, as their fraudulent rehypothecation of gold, several times over, and the virtually depleted reserves now rest comfortably in the hands of Russia, China, India, Turkey, et al, none of which will tolerate any more of the reckless mismanagement of the West. It will not end well for those of us in the Western sphere of influence.
The most coveted of all assets around the world has been gold, on a grand scale, and silver, on a smaller scale, but grand relative to diminishing supply. As we asserted last time, it does not matter what the fundamental picture says, for now, the moving forces are those in control of the paper market, and the populations of Western countries. The power will not be ceded willingly nor readily, so one cannot rely upon the known demand factors, no matter how bullishly presented. That information is already in the market, and it has not created the large mark-up most have been anticipating. It ain't happening, yet.
The paper markets, however much manipulated or disconnected from the physical, are the only barometer available, for now. Under normal circumstances charts, which reflect the market forces, are the most reliable source of information. Here is what they are saying, at this point in time.
In our last article, we said that time was on the side of those currently in control, and it would take longer than most expect before gold and silver will reach previous highs and yet higher, after that, [The True Story Is About Time, http://bit.ly/12iELsC]. In another previous article, we explained how wide range bars can lead to range control for several more bars to follow, and longer, [It Could Get Uglier And Take Longer, click on http://bit.ly/18AlO9G], and we will give more examples of why any recovery will take more time.
The one caveat would be a V-type bottom, when price takes off from a low. Because Anything Can Happen, and no one knows in advance how a market will unfold, it is mentioned as a possibility.
Trading Range, [TR], - A, shows the wide range bar from April, and the close is mid-range the bar. Very often, that bar's range will contain price behavior for several bars into the future. TR - B is pointed out to demonstrate that an ensuing TR can take quite some time. Going into the last week of May, the range has been under the close of April, telling us the attempt to rally has been weak.
Even with the sharp decline from last month, and the overall decline since September of 2011, there is still bullish spacing. It occurs when the current swing low is above the last swing high, from 2008. It tells us that buyers have been willing to buy into the market without waiting to see how the last swing high will be tested, an overall bullish condition.
Gold Monthly Chart
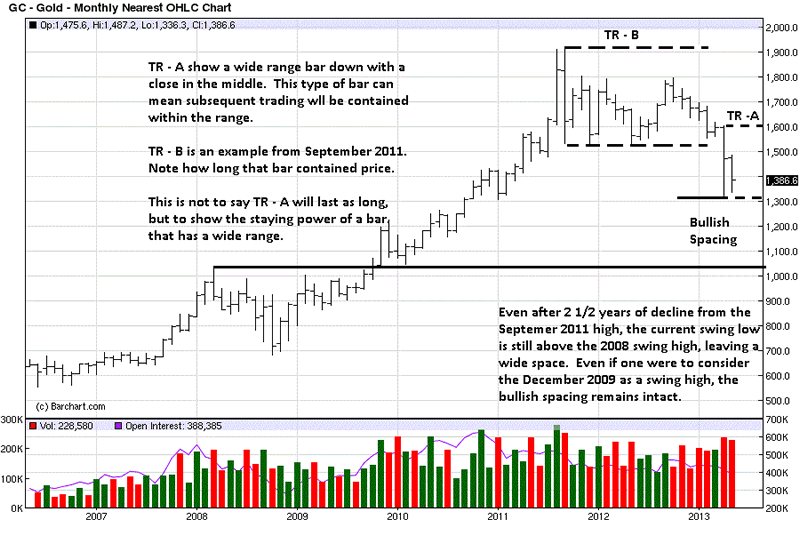
The importance of a wide range bar is that it tells us of the likelihood of a trading range. One can either sell the top of the range and buy the bottom of the range, or wait, knowing that the market is unlikely to rally higher or break lower, for an unknown period of time and then follow the breakout.
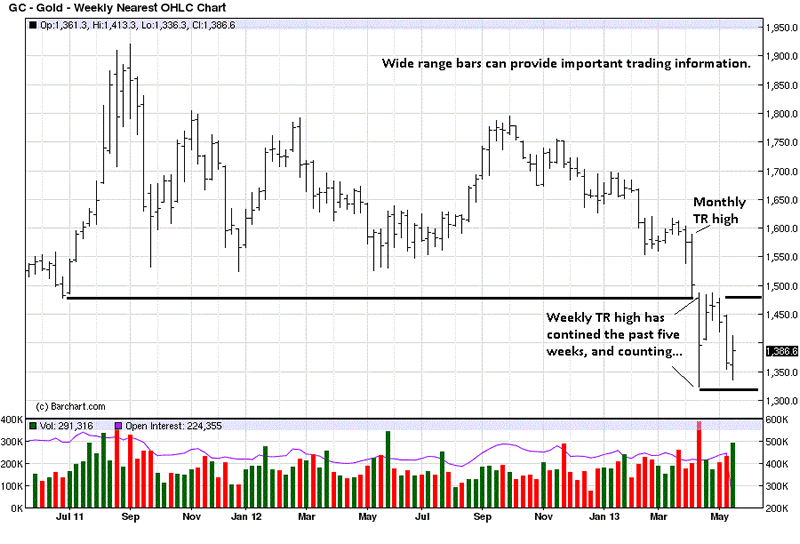
You can see how price has already spent five weeks within the wide range bar with a close in the middle. The high of the range has provided resistance, and the lower portion has been support. Last week's close was in the upper portion of that range, telling us buyers were in control at lower price levels.
Keep in mind, however, that the trend remains down, and the onus is on buyers to show a change in strength. We do not see that, yet, but this is the paper market. Buyers have amply demonstrated demand in the physical market, but it is no avail, for now.
Gold Weekly Chart
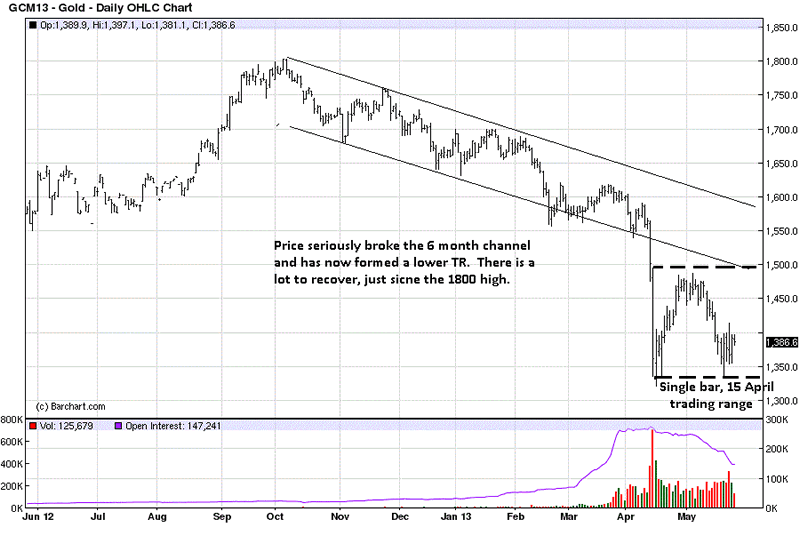
The wide range bar scenario is uniformly persistent over all three time frames. The daily activity looks weakest of all, but still within the range parameters described. Using the "knowledge of the market," from the low of the range, we did use it to advantage to make a short-term trade off the lows, with success. It was an against-the-trend-trade, but we used the smaller time frames and the knowledge that the lower end of the TR would be support, as a basis for it.
Gold Daily Chart
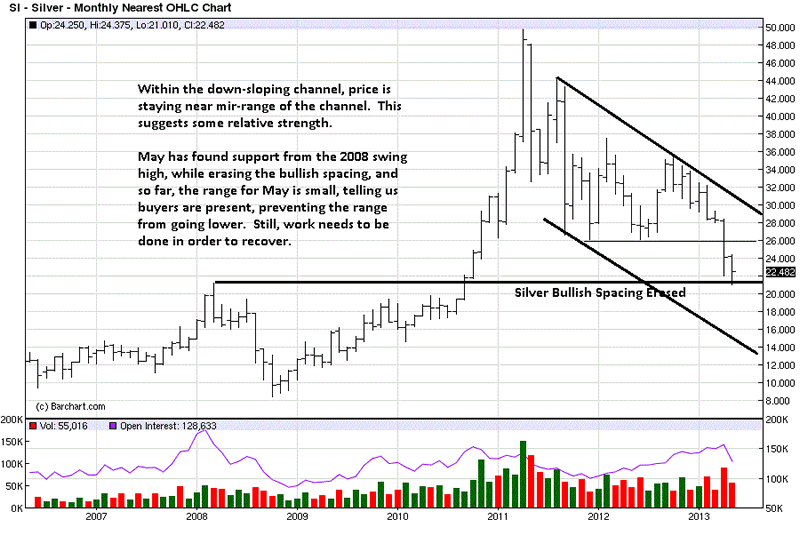
Silver tells a more interesting story. It has been weaker than gold, but the current developing market activity shows promise within a weakened environment. Bullish spacing has been eliminated, and the swing high from 2008 has proven to be support, at least for now.
We drew down sloping channel lines, and interestingly, silver is holding above the 50% of the channel range, not going to the bottom demand line. The underlying implications are bullish, within the context of a prevailing downtrend. It does not mean one should be buying futures, based on this, just that price is holding relatively well in a bear market.
Entering the last trading week for the month, at this late date, the range is relatively small, which tells us that buyers are meeting the efforts of sellers, preventing sellers from moving price lower. It does not mean price will not go lower before month's end, but based on the facts available, it is a positive sign. It could take more time for buyers to turn the futures market around, but it has to start from somewhere.
Silver Monthly Chart
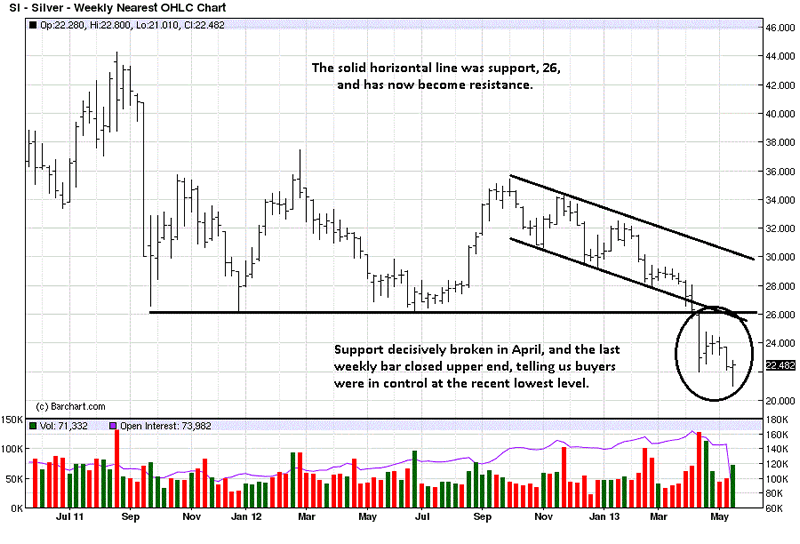
Wide range bars are not inviolate, evidence by the weekly chart. Price did go under the low of the wide range bar, but note the location of the close, at the high of the bar and just above the last week's low-end close of a selloff week.
Siver Weekly Chart
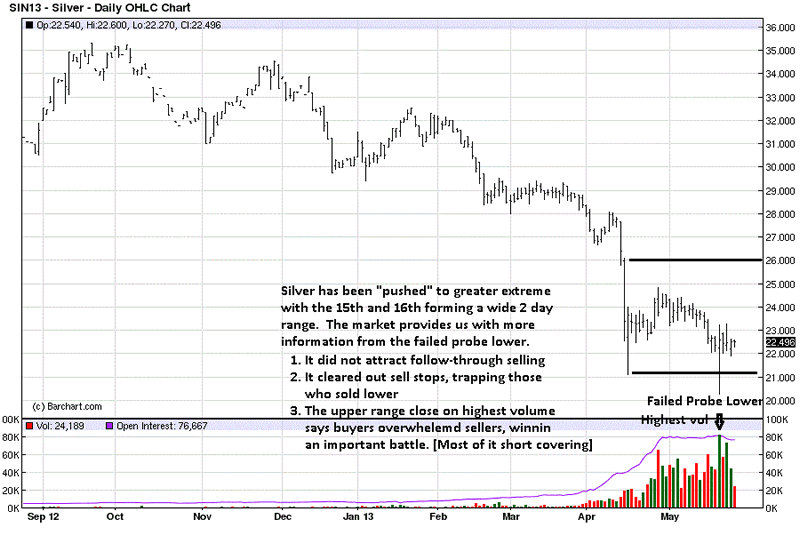
The chart comments relate the current daily activity. Just like TRs reveal important high/low information, failed probes also provide clues about the character of the market. The 3 points made explain what the clues are. The lack of continuation higher speaks to the overall trend being down, weighing on attempts to rally.
We continue to recommend buying the physical, regardless of price, and be very selective if/when trading the futures.
By Michael Noonan
Michael Noonan, mn@edgetraderplus.com, is a Chicago-based trader with over 30 years in the business. His sole approach to analysis is derived from developing market pattern behavior, found in the form of Price, Volume, and Time, and it is generated from the best source possible, the market itself.
© 2013 Copyright Michael Noonan - All Rights Reserved Disclaimer: The above is a matter of opinion provided for general information purposes only and is not intended as investment advice. Information and analysis above are derived from sources and utilising methods believed to be reliable, but we cannot accept responsibility for any losses you may incur as a result of this analysis. Individuals should consult with their personal financial advisors.
Michael Noonan Archive |
© 2005-2022 http://www.MarketOracle.co.uk - The Market Oracle is a FREE Daily Financial Markets Analysis & Forecasting online publication.


