COMEX Gold Revealed - Investigating the Paper Gold Market
Commodities / Gold and Silver 2013 Jun 07, 2013 - 02:05 AM GMTBy: Jan_Skoyles
 Since the gold price crash in April there has been wide debate about how the gold market works. Analysts have contrasted paper gold versus physical gold, urging that the different parts of the gold markets offer very different services to investors. Conspiracy theories have also abounded.
In our previous analysis we looked at the different parts of the gold market and found that the COMEX was still the beating heart of gold price discovery. COMEX still had greater volumes and numbers of bids and offers setting the gold price than the largest ETFs and physical suppliers.
When the gold price tumbled in April, it was the huge orders that had appeared on COMEX that were to blame. Hundreds of tonnes of gold were sold in seconds, knocking prices down dramatically.
For some gold commentators the way the gold price is set on COMEX distorts the gold market, meaning the gold price is often detached from actual gold bullion demand. These analysts argue that since it is mainly paper traded at COMEX and because small percentages of this paper gold can ever be delivered in physical form, COMEX is the flawed central part of setting gold prices.
Gold bullion being drained from COMEX
The recent decrease in inventories, particularly from the JPMorgan warehouse, has attracted much scrutiny of late. Discussion of COMEX settling large gold contracts with cash, rather than gold, i.e. defaulting, continue to animate many a gold market discussion.
Notable investors, such as Eric Sprott, believe the odds of cash settlement occurring in the futures markets are ‘about 100%’.
In light of this we take a look at the health of COMEX and ask if it is close to breaking point.
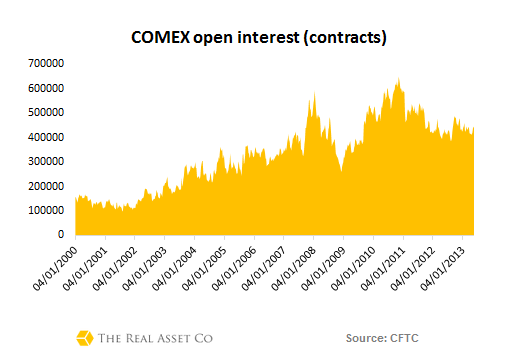
Open Interest on COMEX reached a peak at the end of 2010 at 650,000. It has never reached similar levels since and at the time of writing many appear concerned that the overall open interest is continuing to fall.
However, looking at the graph below there does not appear to be a clear downward trend in activity on COMEX. Market participants appear happy to keep bringing their business to this exchange.
Let’s dig a little deeper into the open interest on COMEX to see what certain classes of market participants are up to.
The Commercials are famed for the bearish positions on gold, yet few seemed to have changed their positions on COMEX. Commercials short positions have even been fallen in 2013, whilst their long positions have been growing.
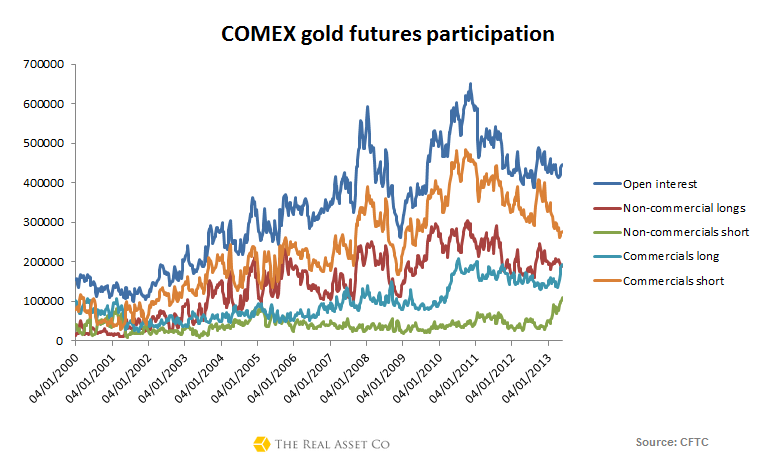
When we first began this study we wondered if we would find Commercial long and short positions to have declined. In truth, there has been very little change since activity peaked in mid-2011.
The graph above also doesn’t reveal any trends showing declining activity amongst Non-commercial market participants either. Their short positions have been rising of late, as they have been culling long positions.
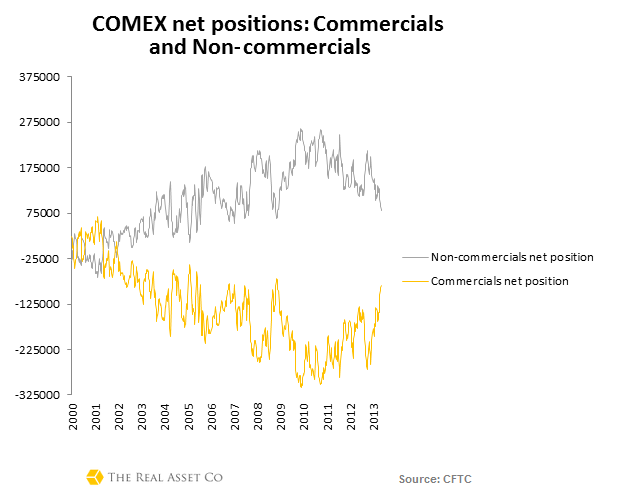
Using the graph below, if we look at Commercial net positions, they have been getting less negative since the beginning of the year, whilst Non-commercial net positions are getting less positive. Neither class of market participant is showing uncharted behaviour in an example of withdrawing liquidity from COMEX.
What about physical gold in COMEX warehouses?
As we said in the introduction, the recent drawdown of gold stocks and the speed at which they have occurred has taken many by surprise and caused some alarm. But is there anything worrying occurring here?
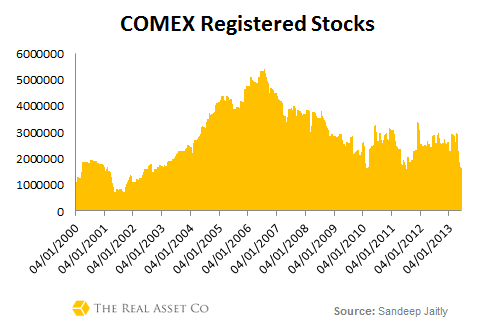
Whilst stocks have been falling, registered ounces of gold ready to meet delivery of contractual positions, remain significantly higher than they were at the beginning of the gold bull market. However COMEX is now much larger market, with greater numbers of ounces represented in open interest. Falling stocks can represent an issue should open interest not be falling in a similar fashion – i.e. if there is more paper gold being traded with less ounces of physical backing it in the vaults.
The shortfall of gold stocks in relation to open interest has existed since 2009, previous to this registered gold stocks were either in surplus or the two tracked one another.
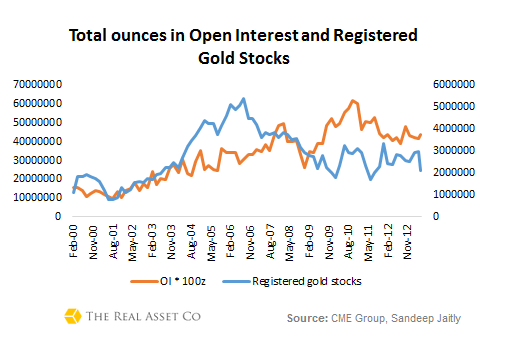
This relatively new phenomena is said to place COMEX under some stress, even if previously, the deficit has been far greater.
How much open interest is actually backed by physical gold?
To understand this we need to look at something called the cover ratio, which tells us what percentage of gold actually backs COMEX obligations.
By inverting Nick Laird’s Owners per Ounce calculation (as done by Bron Sucheki) we are given the cover ratio.
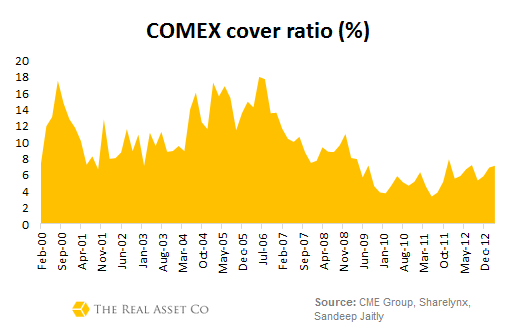
As we saw previously with when we assessed the registered gold stocks to open interest chart, the cover ratio is significantly lower than previously seen and has been declining since mid-2006. In May 2013, the cover ratio fell from 7.12% to 4.8%, its lowest level since August 2011. 2011 saw three consecutive delivery months where cover ratios were particularly low, meaning that current market action is notable but not unprecedented.
N.B. When measuring the cover ratio many analysts use the total gold stocks, registered and eligible together. Whilst aware that COMEX warehouse providers freely reclassify registered gold into eligible gold we have decided to assess the current coverage according to what is available for delivery now.
Another way to measure the sustainability of COMEX
Another key statistic to measure is the ratio of contracts standing for delivery versus open interest. This figure shows you percentage of traded paper gold is taken to delivery. We have to thank Nick Laird of ShareLynx for this data which would have been otherwise unobtainable.
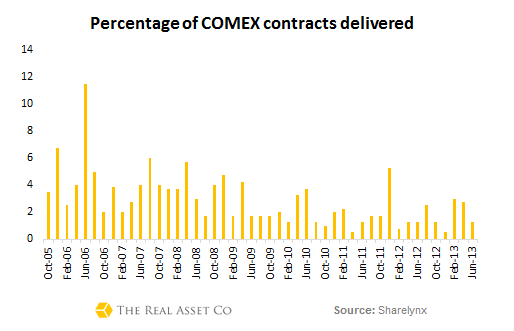
The highest peak of delivery at COMEX was back in 2006, when the ratio was nearly 11%. Since then other peaks seen have been around half of this. Since the beginning of the year the ratio of those taking delivery against open interest contracts has been declining.
So far this year the percentage of those taking delivery has been between 2-3%, small compared to peaks seen in June 2006 and more recently, December 2011. This would suggest, therefore that the drawdown of gold stocks and the fall in cover ratio is not the problem some have suggested it is.
We would guess that in order for COMEX to come under any stress then the delivery ratio would have to increase significantly. This could happen, but it would need notable changes in trading behaviour.
To examine this further we looked at the difference between the delivery ratio and the cover ratio, to establish if enough deliveries are occurring to drain registered gold stocks.
Despite inventory drawdowns, the small fall in open interest and delivery contracts means that the difference between the two ratios has remained relatively constant since the end of 2011.
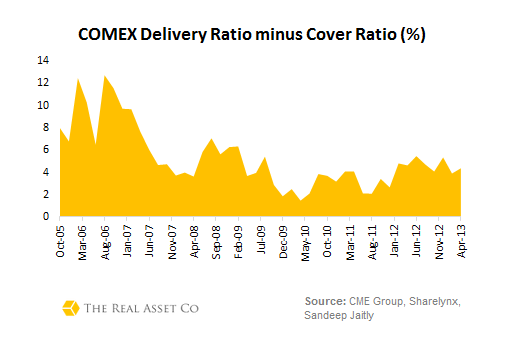
As things currently stand, we would need the number of deliveries need to increase by over 250% to put COMEX under stress.
The stunning activity of JPMorgan
Whilst many COMEX participants have been withdrawing gold from warehouses, one member has taken it to another level recently. Gold analysts have been asking why this is and why this exchange member’s behaviour is so vastly different to others.
Take a look at the graph below to see how JPMorgan has been parting with a lot more gold between Dec 2012 and June 2013 than its nearest comparison points.
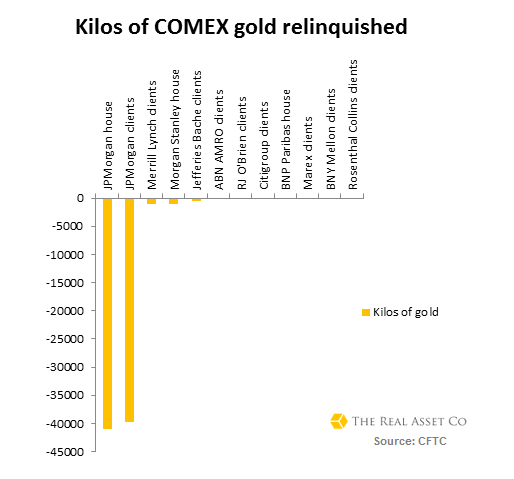
The withdrawals are courtesy of both JP Morgan’s House and Client account.
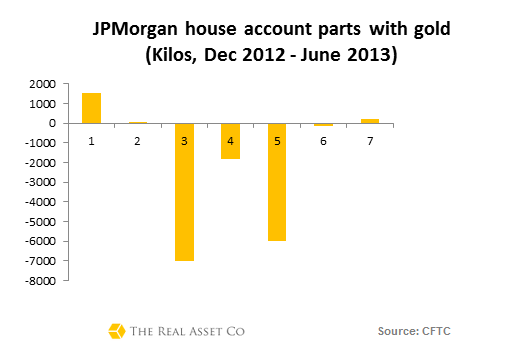
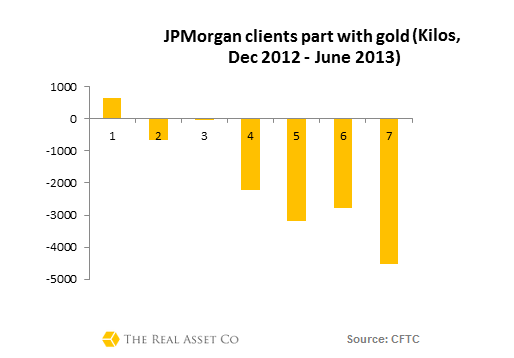
In March and April both saw significant withdrawals, however in other months shown neither withdraws significant amounts at the same time.
JP Morgan’s house account parted with giant amounts of gold in March and April 2013, whilst its clients appeared to then follow this lead with their subsequent behaviour. JPMorgan client have been handing over gold for four months in a row now
Conclusion
Whilst there is little doubt that the amount of stock held in COMEX Warehouses has seen somewhat of a decline, this trend is in line with others exhibiting themselves in COMEX market date.
Whilst numbers of Open Interest have fallen slightly, market participation is not collapsing yet. At the same time, levels of Open Interest are not falling as rapidly as gold stocks, meaning this paper gold is becoming less tangibly backed by bullion. The cover ratio does not, as yet, appear to be at unprecedented low levels even if we should keep a close eye on it.
We also need to look out for the delivery ratio exceeding the cover ratio. Should this happen the amount of ounces being demanded for delivery will exceed the stock of registered gold ounces at COMEX.
Being a fractional market COMEX is vulnerable to runs, as banks are, but at this time COMEX continues to function and hold the liquidity monopoly in the gold markets accessible to Western investors.
As our last piece of gold market research found, COMEX is the heart of gold price discovery. An increase in the delivery ratio is not an impossibility given the current rush for gold by our Asian contemporaries and the unsteady macroeconomic situation. Therefore, in part III of this series we will take a further look into what might happen to gold price discovery should COMEX falter and huge volumes of bids and offers present themselves at other liquidity points in the gold market.
Jan Skoyles contributes to the The Real Asset Co research desk. Jan has recently graduated with a First in International Business and Economics. In her final year she developed a keen interest in Austrian economics, Libertarianism and particularly precious metals. The Real Asset Co. is a secure and efficient way to invest precious metals. Clients typically use our platform to build a long position and are using gold and silver bullion as a savings mechanism in the face on currency debasement and devaluations. The Real Asset Co. holds a distinctly Austrian world view and was launched to help savers and investors secure and protect their wealth and purchasing power.
© 2013 Copyright Jan Skoyles - All Rights Reserved Disclaimer: The above is a matter of opinion provided for general information purposes only and is not intended as investment advice. Information and analysis above are derived from sources and utilising methods believed to be reliable, but we cannot accept responsibility for any losses you may incur as a result of this analysis. Individuals should consult with their personal financial advisors.
Jan Skoyles Archive |
© 2005-2022 http://www.MarketOracle.co.uk - The Market Oracle is a FREE Daily Financial Markets Analysis & Forecasting online publication.


