Which Way For Gold Price From Here?
Commodities / Gold and Silver 2013 Jun 08, 2013 - 07:38 PM GMTBy: Sy_Harding
 Without looking very hard you can find just about any outlook for gold, and a reasonable explanation for that outlook, that you might need to fit in with your own expectation.
Even though gold is down 27% from its 2011 top, well past the 20% decline that defines a bear market, gold bugs insist on calling it a brief correction, and have been repeatedly calling the bottom at each short-term rally attempt all the way down.
But previously very bullish banks and brokerage firms that were calling for $2,000 to $2,200 gold as recently as six months ago, have been scrambling to lower their forecasts with each further decline in gold’s price. Analysts at Credit Suisse have lowered their forecast to $1,100 an ounce for 2013, and lower than that over the next five years.
Yet Bloomberg reported today that “Gold traders are the most bullish they have been since the bear market began.” They base that on the sharp decline in short-selling of gold futures last week.
We prefer technical analysis and technical indicators, which don’t know who is buying or selling, or why, but watch for meaningful reversals in momentum and money flows.
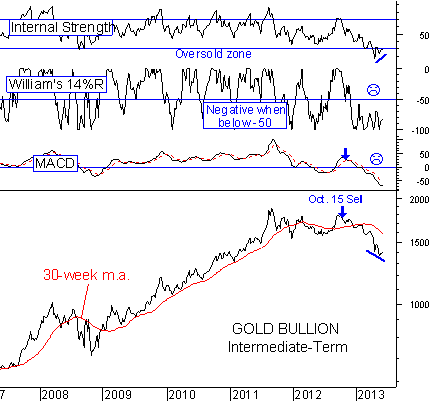
Gold topped out at its record high of $1,900 an ounce in 2011, then rallied back last year, only to see that rally fail at a lower high last October, not a good omen.
And the intermediate-term technical indicators have been on a sell signal for gold since last October.

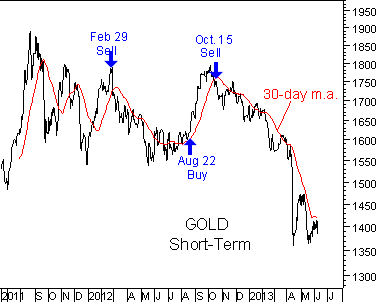
Since then, each time gold became short-term oversold beneath its 30-day moving average, a rally attempt has taken place off that short-term oversold condition, raising hope that the correction had ended.
But the intermediate-term indicators remained on the sell signal, and so far each time gold climbed back short-term to the resistance at the 30-day m.a., the rally attempts have failed.

At some point one of these short-term rally attempts will succeed in breaking through at least that first level of short-term resistance.
We had hopes this current attempt might be the one, since gold’s last pullback was to a higher low, leaving a potential double-bottom in place. Combined with the oversold condition of our intermediate-term technical indicators, this rally attempt has had us watching for a potential new buy signal.
The jury is still out on that. But once again it looks like a rally attempt is failing at the 30-day m.a. The moving average is at $1,419 an ounce. Gold has been as high as $1,416 several times over the past week or so. But today it’s back down $30 an ounce at $1,383.
At this point, a meaningful break to a new low below $1,360 an ounce would be ominous, while a meaningful break-out above the 30-day m.a. at $1,419, would be a potential positive.
For now anyway, the intermediate-term technical indicators remain on the October 15 sell signal. So in my opinion it’s still a time to steer clear of gold and the mining stocks, and not jump the gun on the indicators, while recognizing the conditions, and remaining alert for a possible buy signal.
Sy Harding is president of Asset Management Research Corp., and editor of the free market blog Street Smart Post.
© 2013 Copyright Sy Harding- All Rights Reserved
Disclaimer: The above is a matter of opinion provided for general information purposes only and is not intended as investment advice. Information and analysis above are derived from sources and utilising methods believed to be reliable, but we cannot accept responsibility for any losses you may incur as a result of this analysis. Individuals should consult with their personal financial advisors.
Sy Harding Archive |
© 2005-2022 http://www.MarketOracle.co.uk - The Market Oracle is a FREE Daily Financial Markets Analysis & Forecasting online publication.


