Stock Market Crosscurrents & Miracles
Stock-Markets / Dow Theory Mar 22, 2008 - 06:23 AM GMTBy: Tim_Wood

 With the close one week ago on March 14, 2008 , the equity markets were literally sitting on the edge of the abyss. The short-term T-bill rate had collapsed to just over 1% while the Discount rate was sitting at 3.5%. My Fed model suggested that another healthy cut was imminent and with the spread between the 3-month T-bill rate and the Discount rate at over 2% the Fed was forced to take action. On Sunday night, March 16, 2008, as the overseas markets opened they began to plummet, making it obvious that we were indeed sitting on the edge of the abyss. In a surprise, or should I say desperate, meeting on Sunday night the Fed cut .25% and on Monday the equity markets initially sold off sharply, but then recovered and closed the day marginally positive. On Tuesday the Fed cut the Discount rate another .75% and the Dow Jones Industrials closed up 420 points.
As I have said over and over again, history tells us that the Fed simply follows the path of the short-term credit markets and these rate cutes do not ultimately matter. It is the perception that has been spun by the propaganda machine that “Daddy”, the Fed, is going to make everything alright by cutting rates. This is complete and total bunk. History clearly shows that rate cutting and rate hiking cycles are independent cyclical events from the cycles in the equity markets. Sometimes these cycles converge in a manner in which there appears to be a relationship of lower interest rates equating to higher equity prices. This is just not true and the most recent example of this occurred surrounding the decline out of the 2000 top. From the time the Fed began to cut in January 2001 the Industrials ultimately fell over 3,400 points in spite of the fact that they cut the Discount rate from 7.50% to 2.75% during this time frame.
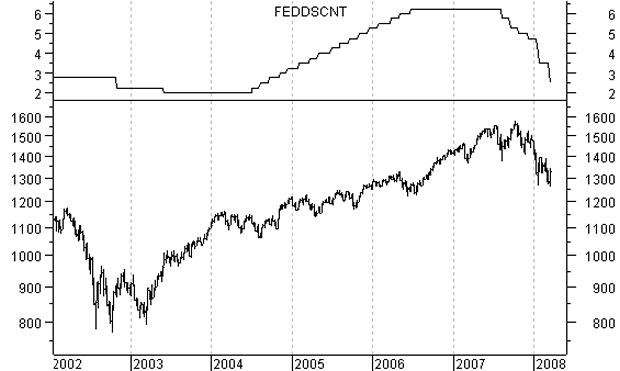
In regard to the current rate cutting cycle, my Fed model first turned negative in June 2007. In August the short-term credit markets began collapsing and as a result “Daddy” was forced to begin cutting rates once again. At the same time the equity markets began to get hit and the spin was that the Fed was cutting the rates in response to the falling equity markets. Bologna! Since June, the Discount rate has been lowered from 6.25% to 2.50% and since their October high the Industrials have dropped a total some 2,400 points. So again, rate cuts aren't exactly helping the situation, yet people continue to believe that Daddy is in control of the situation and that he is going to make everything Okay. In the first chart below you can see that since the 2007 top the S&P has dropped 20% in spite of the fact that the Discount rate has dropped from 6.25% to 2.50%.

So, as I look back in history it is undeniable that cutting interest rates will not stop the equity markets from sliding when they are in a declining cycle. It is however interesting to note that as the markets were sitting on the edge of the abyss and began approaching the January 22 nd lows, Daddy announced a program to swap $200 billion in Treasuries for debt including mortgage-backed securities. On Sunday night there was an emergency rate cut of .25% and again on Tuesday another .75% rate cut followed. On Thursday Daddy loaned $28.8 billion to large U.S. securities firms under a program that was announced on Sunday night. This was reported to be the first such extension of credit to non-banks since the 1930's. This last week Daddy also made available $30 billion to JP Morgan for the bailout/buyout of Bear Stearns. As a result, there has been what I term an “engineered” double bottom by these unprecedented events. The question now is, “Will this bottom hold and have we seen the 4-year cycle low?”
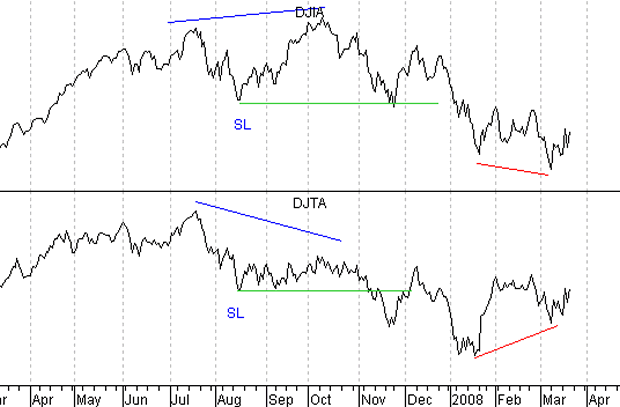
From a Dow theory perspective we now have a non-confirmation in place as is noted in red. This non-confirmation does serve as a possible warning that the trend could be trying to change. However, until such confirmation actually occurs, the existing bearish Primary Trend that was confirmed on November 21 st will officially remain intact.

From a cyclical perspective, which has absolutely nothing to do with Dow theory, the move into the extended 4-year cycle low remains on track, at least so far anyway. Anything is possible and perhaps the Fed has engineered a bottom that could last a while. In the end it won't hold and they continue to only make matters worse. From my seat, the key guide is my intermediate-term Cycle Turn Indicator. This indicator is designed to identify important intermediate-term trend changes. This indicator identified the 1929 top and the crash that followed as well as the top of the 1930 rebound and the beginning of the decline into the 1932 low. It also called the 1987 top beautifully.
In the last article reported here I stated that the market was holding on by the skin of its teeth and that has indeed proven to be the case. As the markets approached the January 22 nd lows this past week the Cycle Turn Indicators suggested that the low would hold. This has since proven correct. The question now is for how long. If the Cycle Turn Indicator called these other major declines, then odds are it will signal any major decline in the present.
Until such time we are operating in an environment with many cross currents. The existing Dow theory primary trend is bearish, yet the Fed is fighting the situation tooth and nail. We also have a Dow theory non-confirmation and the backdrop surrounding the unwinding of this extended 4-year cycle. The best key I have found to navigate this financial minefield is the intermediate-term Cycle Turn Indicator, which has proven itself time and time again. More detailed information on the statistics surrounding equities, commodities and the Cycle Turn Indicator are available through a subscription to Cycles News & Views. Please visit www.cyclesman.com for details.
By Tim Wood
Cyclesman.com
© 2008 Cycles News & Views; All Rights Reserved
Tim Wood specialises in Dow Theory and Cycles Analysis - Should you be interested in analysis that provides intermediate-term turn points utilizing the Cycle Turn Indicator as well as coverage on the Dow theory, other price quantification methods and all the statistical data surrounding the 4-year cycle, then please visit www.cyclesman.com for more details. A subscription includes access to the monthly issues of Cycles News & Views covering the stock market, the dollar, bonds and gold. I also cover other areas of interest at important turn points such as gasoline, oil, silver, the XAU and recently I have even covered corn. I also provide updates 3 times a week plus additional weekend updates on the Cycle Turn Indicator on most all areas of concern. I also give specific expectations for turn points of the short, intermediate and longer-term cycles based on historical quantification.
Tim Wood Archive |
© 2005-2022 http://www.MarketOracle.co.uk - The Market Oracle is a FREE Daily Financial Markets Analysis & Forecasting online publication.


