


S&P 500 P/E Ratio versus 10-Yr Treasury Interest Rates From 1957
Stock-Markets / Stock Market Valuations Jun 24, 2013 - 06:32 PM GMTBy: Richard_Shaw

 In our recent post, we used historical mean reversion to estimate the Fed’s target rate for 10-year Treasuries, 30-year mortgages, and Baa corporate bonds, based on the Fed’s 2% inflation target. One commenter wrote to us and asked what that implied for the S&P 500 P/E ratios.
We looked at the monthly history of trailing P/E ratios for the S&P 500 since its inception in March 1957, and conclude that there is no useful rule of thumb about P/E ratios and interest rates in the interest rate range from 4% to 6%. At much higher interest rates, P/E’s do become depressed; which relates the to business stifling aspects of very high rates. However, the 4% to 6% range, which is what we may face in next year or two, has not historically been a problem.
P/E ratios, we believe, have much more to do with expected earnings growth rates, which we will examine historically in a subsequent post.
For those who argue that businesses today could not cope with 4% to 6% interest rates, they would expect multiple contraction. However, for those who believe that 4% to 6% rates could be handled in a growth economy, this data gives no reason to expect multiple contraction.
To attempt to dispose of the P/E versus interest rate question, here are two charts — one with no cap on the P/E, and another with a 30x cap on the P/E to “open up” the tight cluster areas of the chart.
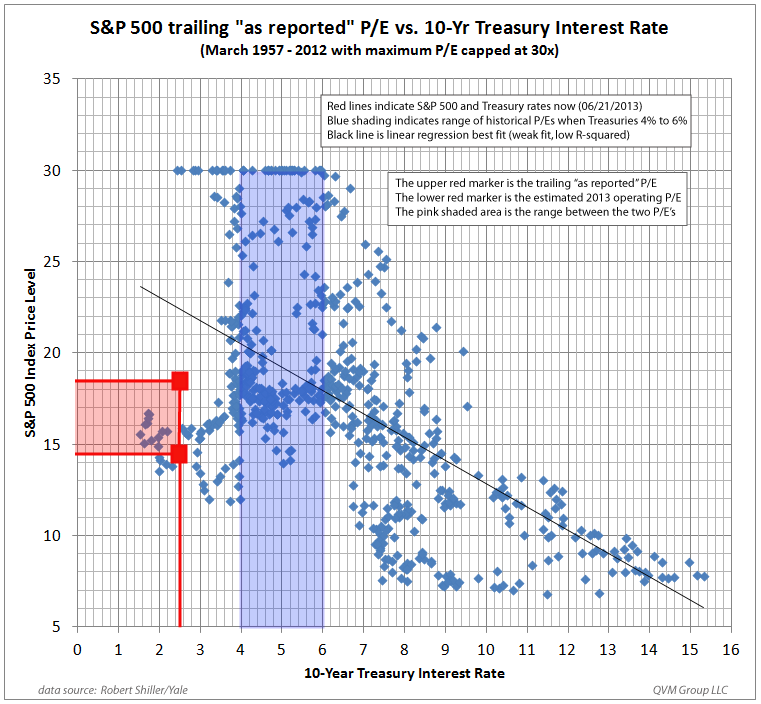
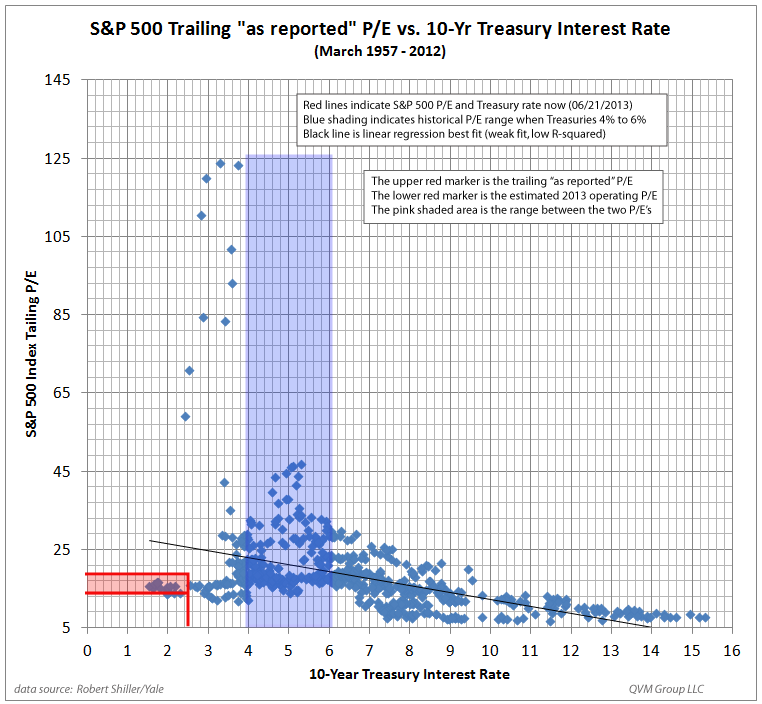
The charts have linear regression trend lines applied, but the fit (R-squared value) is weak. The huge scatter is clear on both charts.
The current situation with an approximate 14.5x 2013 estimated operating P/E, 18.4X trailing “as reported” P/E, and an approximate 2.5% 10-year Treasury yield is positioned in the low end of P/E ratios for the current interest rate. The current P/E, based on this history, could be maintained at higher interest rates without getting out of the historical range.
The red lines plot the current S&P and Treasury status. The blue shading highlights the P/E ratios that have occurred when 10-year Treasuries had interest rates between 4% and 6% — the general nominal rate range we believe the Fed is targeting.
To our commenter, P/E ratios are not correlated with interest rates.
Our view is conventional: If higher interest rates correspond to an improving economy, earnings may be improving which would support the current or even higher P/E ratios; and that if higher interest rates caused earnings to decline, then multiples would be reduced causing stock prices to decline.
We will look at forward earnings and dividend yield versus interest rates in subsequent posts.
By Richard Shaw
http://www.qvmgroup.com
Richard Shaw leads the QVM team as President of QVM Group. Richard has extensive investment industry experience including serving on the board of directors of two large investment management companies, including Aberdeen Asset Management (listed London Stock Exchange) and as a charter investor and director of Lending Tree ( download short professional profile ). He provides portfolio design and management services to individual and corporate clients. He also edits the QVM investment blog. His writings are generally republished by SeekingAlpha and Reuters and are linked to sites such as Kiplinger and Yahoo Finance and other sites. He is a 1970 graduate of Dartmouth College.
Copyright 2006-2013 by QVM Group LLC All rights reserved.
Disclaimer: The above is a matter of opinion and is not intended as investment advice. Information and analysis above are derived from sources and utilizing methods believed reliable, but we cannot accept responsibility for any trading losses you may incur as a result of this analysis. Do your own due diligence.
Richard Shaw Archive |
© 2005-2022 http://www.MarketOracle.co.uk - The Market Oracle is a FREE Daily Financial Markets Analysis & Forecasting online publication.