Stock Market Looks To Head Lower
Stock-Markets / Stock Markets 2013 Jun 30, 2013 - 03:47 AM GMTBy: Michael_Noonan
 What is the message of the market as the week, month, 2nd Qtr, and first half of the year
just ended? The second half of the year is likely to prove more troubling for the Bulls. We
do not make predictions for a future that has not yet happened, but an assessment on what
may unfold for the remainder of the year is about to begin on a weaker tone, based on the
developing market activity.
All of the available news, information, data, fundamentals, technicals, from any and all sources eventually gets translated into the market as the driving force[s] that create the trends and trading ranges. Everything gets distilled into a bar chart, showing a high, a low, and where the final closing price occurred. An important add-on to that critical information is volume, the energy, or lack of energy behind each and every market move, in all time frames.
Yes, yes, it seems so basic to state, but the information to be gleaned from reading bars and volume escapes the majority of participants. Ironically, the ultimate message of the market, the most reliable source of information receives the least amount of credibility. Fundamentalists treat charts as an amusement. Technical analysts try to harness the market’s energy of information into some formula, imposing past tense indicators onto present tense activity, and expecting accurate future direction.
This is not a review lecture of various forms of market analysis; rather, it is context for understanding that the markets have an incredible amount of logic in the messages that everyone gets to see, for those who so choose, that eliminates all the noise and perhaps the weakest link common to us all, emotion.
The high, low, close, and volume generated by the market is totally void of emotion. The market just is. Any emotion comes from the viewer/reader of that information. If one were to follow the market’s lead, instead of trying to predict what it may or should do, the results for success can improve dramatically.
To chart context we go.
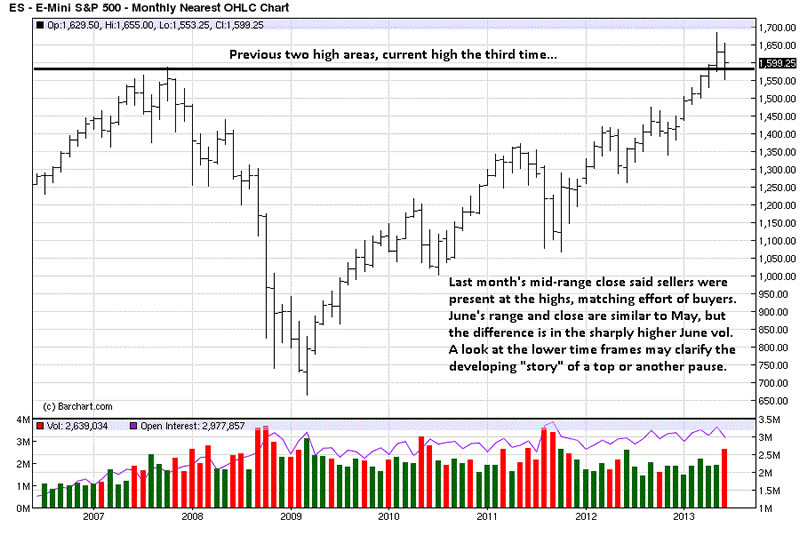
The long-term trend remains up. Factually, there has not been a market turn in price on the monthly chart, as yet, from an objective look at where price is, still near the highs. What we want to do is read the logic of price and volume activity. Last month, price made a new all-time high and closed in the middle of the range. If you look at each bar, since the 2008 low, about 90% of them had a close near the high of the bar’s range.
A close at the high-end of a bar indicates who is winning the “battle of the bar,” between buyers and sellers. Buyers have been in control of this market since 2008. Why is the close for May mid-range the bar? The market is telling us sellers were meeting the effort of the buyers, a draw between the two forces. What is interesting to note is that the draw occurred at the highest level of the rally.
Aren’t buyers supposed to be in control at market highs? It has been that way for the past five years! The question it begs is, why is the market showing a change in behavior at this critical juncture? We do not need to know the fundamentals. We do not need to know the market is above a series of moving averages, [past tense, and lagging information]. We do not need to view RSI, MACD, Bollinger Bands, you name it. None of them addresses what is developing right now!
June just ended, and we see a similar bar that also closes mid-range. Do both bars mean the same thing? No. Why not? Look at the volume for June v May. The composition of the internal makeup between the two has to be different, based on that observable fact. Monthly bars are for context, not for timing. To get a better read of the June activity, we need to see the nest lower time frame, a weekly chart.

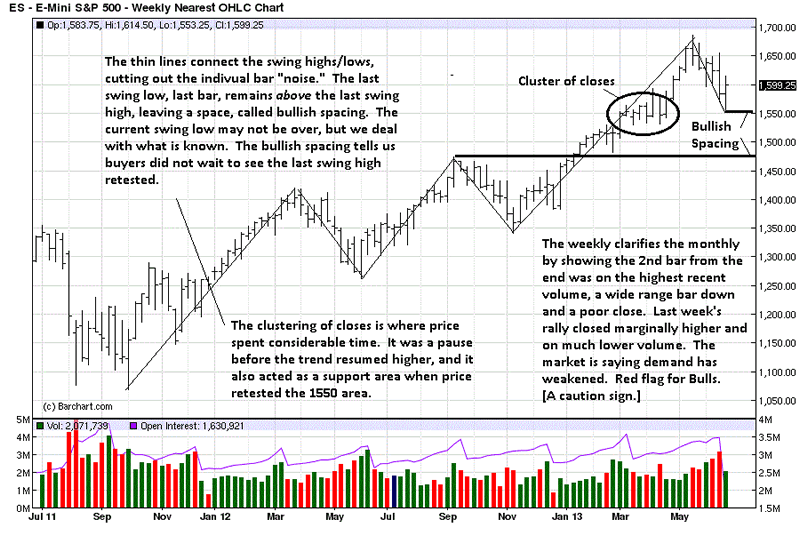
A line has been drawn to connect the swing highs and lows to get a view of the overall trend without the “noise” in between. We can now see the composition of the monthly June bar, and it shows the largest weekly bar was to the downside with a low-end close. That factual observation has a negative connotation. When you add to it the volume, the highest weekly volume in over a year, the market is telling us that the increased energy was to the downside. These are indisputable, objective facts.
The last bar, last bar of the month, was a rally. An objective comparison shows it is smaller in range than the previous down bar, [less ability to rally], and while the close is at the upper end of the bar, [buyers "win" the day], it did not close much higher than the weaker bar, and compare the close of the second bar to the close of its preceding close. There was a greater distance down than there was up, in the last bar.
Finally, note the sharp drop in volume on the last weekly bar. Demand lessened on the rally effort. What happened to the buyers? This is a red flag, a warning. The trend of the monthly and weekly charts remain up, but the internal character has weakened.
The clustering of closes from March and April acted as a support when last week’s low retested the 1550 area. There is still bullish spacing, where the current swing low remains above the last swing high. What we need to watch more closely, moving forward, is how future rallies develop. Will volume increase, or not? Will the closes be strong or weak?
We turn to the daily to see how its details reflect the content of the weekly.

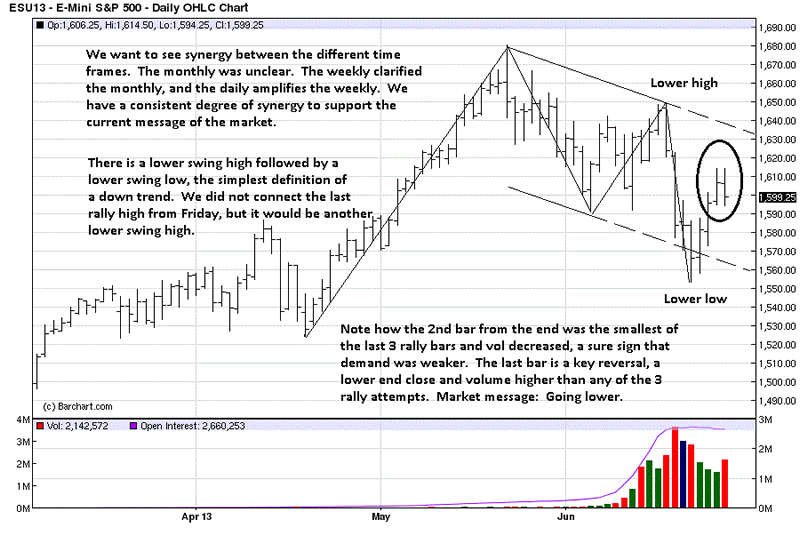
Connecting the swing highs and lows, the daily time frame shows lower highs and lower lows, the essence of a downtrend. The smaller time frames show faster developing market activity than the higher time frames, and changes in the lower time frames occur before there is a change in the higher time frames.
The downtrend on the daily justifies the red flag warnings on the monthly and weekly charts. It is a read of the three different time frames that tells us the market looks to head lower. The strength of the higher time frames takes more effort to turn them, so we can expect more rally efforts, rather than an immediate decline underway.
What we can look for, based on developing market activity, is stronger declines and weaker rallies. Plan accordingly.
As an aside, last Thursday, we issued a potential short trade alert in the S&P to our blog subscribers, IF what we saw developing confirmed expectations, http://bit.ly/19KEwew. We did it as an exercise to demonstrate one does not need to predict the markets, but to be prepared for what follows developing market activity up to the point of making a decision to buy or sell in the market[s].
If a signal occurred, and the trade work, it was known in advance for specific reasons and not in hindsight. We were looking for a weak rally that failed. Our preparation worked, in that aspect, because it kept us out of a trade potential that then became questionable.
What developed was market weakness right from the start and not a rally. Price then vacillated the rest of the day, but there was no reason to sell, based on developing market activity. The emotional element that plagues us all was removed, based on preparation and the lack of a reason to execute.
Price did sell off at the end, unexpectedly, but that is a somewhat different story. Turns out, we had a similar set-up in 30 Year Bonds, a trade we did recommend making, and for the reasons similar to those in the S&P alert.
Those who remain long in the stock market are getting red flag messages. They should be heeded.

By Michael Noonan
Michael Noonan, mn@edgetraderplus.com, is a Chicago-based trader with over 30 years in the business. His sole approach to analysis is derived from developing market pattern behavior, found in the form of Price, Volume, and Time, and it is generated from the best source possible, the market itself.
© 2013 Copyright Michael Noonan - All Rights Reserved Disclaimer: The above is a matter of opinion provided for general information purposes only and is not intended as investment advice. Information and analysis above are derived from sources and utilising methods believed to be reliable, but we cannot accept responsibility for any losses you may incur as a result of this analysis. Individuals should consult with their personal financial advisors.
Michael Noonan Archive |
© 2005-2022 http://www.MarketOracle.co.uk - The Market Oracle is a FREE Daily Financial Markets Analysis & Forecasting online publication.


