


Stock Market Downtrend May Have Bottomed
Stock-Markets / Stock Markets 2013 Jul 01, 2013 - 06:32 AM GMTBy: Tony_Caldaro

 Wild week! Monday started off with a gap down opening pushing the SPX down to 1560. Then for the next three days the market gapped up, hitting SPX 1620 on Thursday. Friday appeared to be a consolidation day as the SPX ended the week at 1606. For the week the SPX/DOW were +0.80%, the NDX/NAZ were +1.25%, and the DJ World index rose 1.3%. On the economic front positive reports outpaced negatives 11 to 5. On the uptick: durable goods orders, Case-Shiller/FHFA prices, consumer confidence/sentiment, new/pending home sales, personal income/spending, PCE prices, plus weekly jobless claims improved. On the downtick: Q1 GDP, Chicago PMI, median home prices, WLEI and the monetary base. Next week, a holiday shortened one: monthly Payrolls, Auto sales and ISM.
LONG TERM: bull market
We have counting this bull market as Cycle wave [1] of a multi-decade Super Cycle bull market. Typically these bull markets last about five years and unfold in five Primary waves. Primary waves I and II completed in 2011, and Primary wave III has been underway since then. Primary I divided into five Major waves with a subdividing Major wave 1. Primary III is also dividing into five Major waves, but both Major waves 1 and 3 are subdividing into five Intermediate waves.
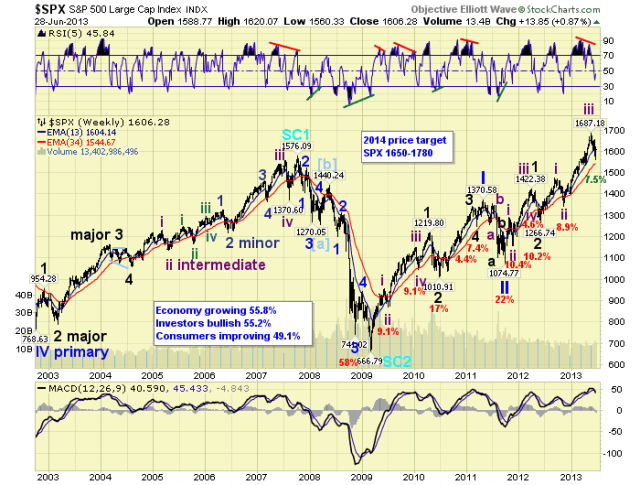
Major waves 1 and 2, of Primary III, completed by mid-2012. Major wave 3 has been underway since then. Intermediate waves i and ii completed by late-2012, and Int. iii ended in May 2013. The Intermediate wave iv downtrend may have just completed this week, with an Int. v uptrend now underway. When this expected uptrend concludes, possibly July/August, the market will end Major wave 3. Then after a Major 4 correction, a Major 5 uptrend will end Primary III. Finally, after a Primary IV correction a Primary V uptrend should end the bull market. We still expect this to occur by late-winter to early-spring 2014.
MEDIUM TERM: downtrend probably bottomed
We had counted the six month long Intermediate wave iii uptrend as five Minor waves ending at SPX 1687/1674. Over the next four weeks the market corrected 7.5% and confirmed the Intermediate wave iv downtrend. Soon after we received the downtrend confirmation the market started impulsing upward again. This has occurred a few times during this bull market. Nothing unusual.
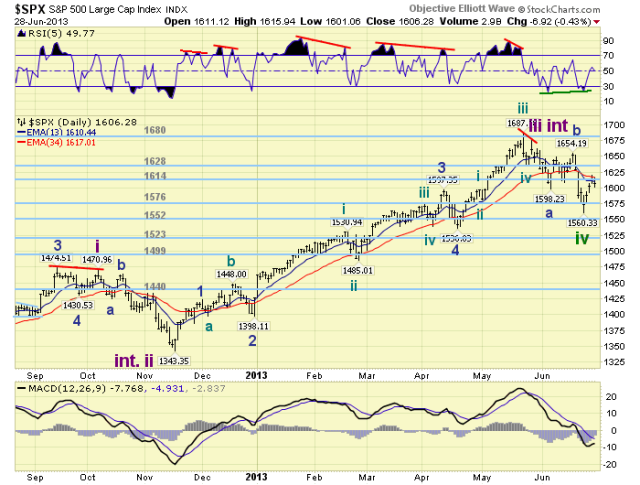
From top to bottom, Intermediate wave iv declined from SPX 1687/1674 to 1560 in a complex a-b-c corrective pattern. The b wave rally was 56 points SPX 1598-1654. Off monday’s SPX 1560 low the market had rallied 60 points into Thursday’s 1620 high. A positive. The rally also appears to be impulsing: wave 1 SPX 1586, wave 2 SPX 1573, wave 3 SPX 1588-1577-1604-1595-1620, wave 4 SPX 1601, and wave 5 SPX 1616 so far. We are expecting this rally to end within the OEW 1628 pivot range for Minor wave 1 of the Intermediate wave v uptrend. Then after a Minor 2 pullback, Minor waves 3, 4 and 5 should complete the uptrend in either July or August. If it completes in July the SPX will probably make a double top at the 1680 or 1699 pivots. If it extends into August we can envision the SPX reaching the 1779 pivot. Currently medium term support is at the 1576 and 1552 pivots, with resistance at the 1614 and 1628 pivots.
SHORT TERM
Short term support is at SPX 1593-1599 and the 1576 pivot, with resistance at the 1614 and 1628 pivots. Short term momentum bounced from oversold Friday morning. The short term OEW charts ended the week negative with the reversal level SPX 1607.
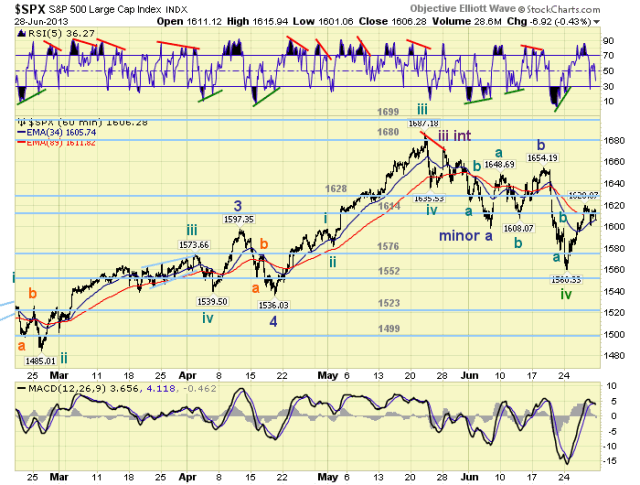
After the SPX 1560 low on Monday the market rallied in what appears to be an incomplete five wave pattern for the rest of the week. We can count four waves completed: 1586-1573-1620-1601 with the fifth wave underway. The market was quite overbought on Thursday, after rallying 60 points off a positive divergence. The oversold condition on Friday should set up a negative divergence when the fifth wave concludes for Minor wave 1, possibly in the 1628 pivot range, next week. Minor wave 2′s, during this bull market, have been fairly steep pullbacks: 38.2% to 50%. Then the Minor waves 3, 4 and 5 should follow. Should the market drop below SPX 1586, however, the Intermediate wave iv downtrend would still be underway. Best to your trading!
FOREIGN MARKETS
The Asian markets were mostly higher on the week for a gain of 2.0%. No uptrend confirmations yet.
The European markets were also mostly higher on the week for a gain of 1.6%. No uptrend confirmations yet.
The Commodity equity group were all higher for a gain of 1.4%. No uptrend confirmation here either.
The DJ World index gained 1.3% on the week.
COMMODITIES
Bonds continue to downtrend and finished the week with a 0.1% loss.
Crude continues to uptrend and gained 2.8% on the week.
Gold is still downtrending losing 5.0% on the week.
The USD appears to be uptrending, gaining 1.0% on the week.
NEXT WEEK
Monday: ISM manufacturing and Construction spending at 10:00. Tuesday: Factory orders and monthly Auto sales. Wednesday: the ADP index, weekly Jobless claims, the Trade deficit and ISM services. Thursday: holiday. Friday: monthly Payrolls report with the Unemployment rate. As for the FED: Tuesday an open board meeting, then a speech by FED governor Powell at 5:45. Best to your weekend, week and holiday!
CHARTS: http://stockcharts.com/public/1269446/tenpp
http://caldaroew.spaces.live.com
After about 40 years of investing in the markets one learns that the markets are constantly changing, not only in price, but in what drives the markets. In the 1960s, the Nifty Fifty were the leaders of the stock market. In the 1970s, stock selection using Technical Analysis was important, as the market stayed with a trading range for the entire decade. In the 1980s, the market finally broke out of it doldrums, as the DOW broke through 1100 in 1982, and launched the greatest bull market on record.
Sharing is an important aspect of a life. Over 100 people have joined our group, from all walks of life, covering twenty three countries across the globe. It's been the most fun I have ever had in the market. Sharing uncommon knowledge, with investors. In hope of aiding them in finding their financial independence.
Copyright © 2013 Tony Caldaro - All Rights Reserved Disclaimer: The above is a matter of opinion provided for general information purposes only and is not intended as investment advice. Information and analysis above are derived from sources and utilising methods believed to be reliable, but we cannot accept responsibility for any losses you may incur as a result of this analysis. Individuals should consult with their personal financial advisors.
Tony Caldaro Archive |
© 2005-2022 http://www.MarketOracle.co.uk - The Market Oracle is a FREE Daily Financial Markets Analysis & Forecasting online publication.