


Telegraphing the Turnaround in Gold Price
Commodities / Gold and Silver 2013 Jul 09, 2013 - 10:13 AM GMTBy: Jeff_Clark

 As of last Friday, gold has now fallen as much 35.4% (based on London PM fix prices) over 96 weeks. But if you're like us, you still recognize that the core reasons for investing in gold haven't changed. People who sold their gold recently made a shortsighted decision. Before too long precious metals will rebound—and probably in a big way.
But when? Does history have any clues about how long we'll have to wait for that rebound?
Perhaps the most constructive way to forecast a turnaround in gold is to look at how its price behaved in prior big corrections.
Here's an updated view of gold's three largest corrections since 2001, along with the time it took the price to return to the old high and stay above that level.
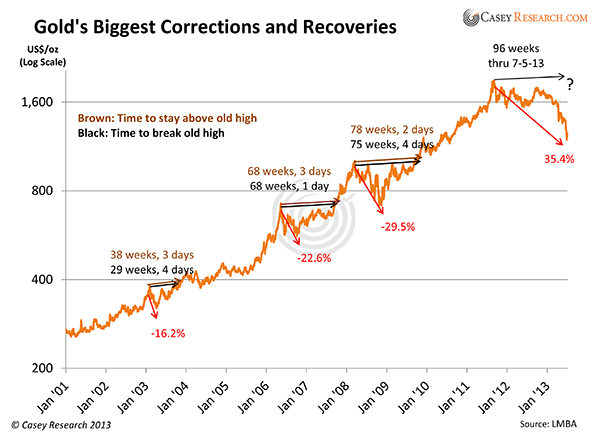
It has taken a significant amount time for gold to return to old highs after each big selloff this cycle. And the bigger the correction, the longer it has taken—with each correction lasting longer than the last.
However, I think our current correction more closely resembles what occurred in 1974-1976 than any of the dips so far this cycle. Here's an updated overlay of the gold price then and now.

As you can see, during the big correction of the 1970s, gold declined 47% and took 187 weeks to recapture old highs. This fits in with the pattern discussed above: the bigger the correction, the lengthier the recovery. Another interesting pattern: the time to reach new highs always equals or exceeds the duration of the decline.
While the current correction hasn't been as deep as that of the mid-'70s, the decline is already longer, and it's the most prolonged of the current cycle. It is thus reasonable to expect gold to take two years or more to regain the $1,900 level and continue beyond. Barring a black swan event, gold will likely log its first annual loss since 2000 this year. These are not predictions, just possibilities, and a reminder that if gold is slow to recover, it's simply adhering to past patterns.
However, it's not all bad news, as the chart shows: gold nearly doubled in the two years from its '76 low to its '78 return to former highs. The message here is obvious: add to your inventory at depressed levels. And don't worry about missing the bottom; investors who waited to buy until gold had retraced 30% of its decline still netted about a 70% gain once it returned to prior highs.
The same patterns hold true with stocks. You can see the high-to-low-to-prior-high time frame was longer, but the gains were bigger once the dust settled.
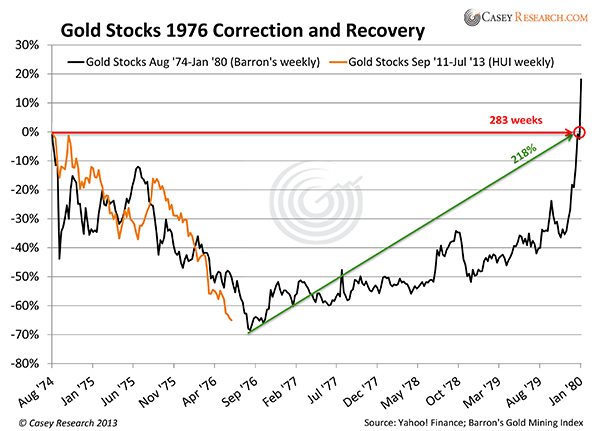
Investors who bucked the conventional wisdom of the day and bought a basket of gold and silver producers in the autumn of 1976—after they had dropped by almost 70%—more than tripled their investment. We're now approaching the degree of selloff that was seen then, setting up a similar opportunity to profit.
Don't let the long recovery times shown in the charts deter you. Stay focused on the pattern; once the declines reversed, the general trend was up. Contrarians and forward-thinking investors need to prepare for that reality, rather than take umbrage with how long it might take to beat old highs. By the time mainstream analysts—who know little about gold in the first place—declare it has entered a "new" bull market, the lows will be long behind us, along with the best buying opportunities.
Selloffs Can Be Profitable Setups
Once gold bottomed at $103.50 on August 25, 1976, the trend reversed and the metal rose a whopping 721% to peak at $850 on January 21, 1980.
Silver's climb was even more dramatic. From its 1976 low of $4.08, it soared 1,101%. This is the 10-bagger grail of investing, where investors had the chance to add a zero to their initial investments.
But remember: the process was multiyear and began after a dismal two-year decline that was punctuated with sharp selloffs, similar to gold's behavior since its 2011 high. While that's a stupendous return within a short time frame, the biggest gains were seen in the final five months. The patience of some investors would certainly have been tested in those first three years.
Here's a look at the gains for the metals from their respective lows.
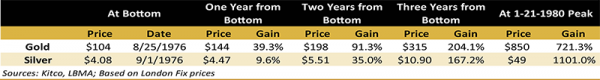
Both gold and silver logged double-digit returns every year after the bottom (except silver the first year). Once the momentum had shifted, buying and holding while the fundamental forces played out led to huge profits. No "trading" was necessary; just buy after a big correction and hold on for the ride.
No need to attempt to time the bottom, either; those who bought a year after the lows still reaped gains of 490% for gold and 996% for silver. The largest chunk of profits came in the second year and beyond.
Also of note is that the second leg up in precious metals was bigger than the first. There's no reason to think we won't experience the same thing this time around.
The messages from history are self-evident:
- Be patient. Odds favor gold emerging from a period of price consolidation and volatility. This process will take time.
- Be prepared. Big gains follow big selloffs. We can't be certain if the final bottom is in yet, but buying at these levels will ultimately net big profits if you're buying the most solid of the major producers and potentially life-changing gains if you're buying the best juniors.
© 2013 Copyright Casey Research - All Rights Reserved
Disclaimer: The above is a matter of opinion provided for general information purposes only and is not intended as investment advice. Information and analysis above are derived from sources and utilising methods believed to be reliable, but we cannot accept responsibility for any losses you may incur as a result of this analysis. Individuals should consult with their personal financial advisors.
Casey Research Archive |
© 2005-2022 http://www.MarketOracle.co.uk - The Market Oracle is a FREE Daily Financial Markets Analysis & Forecasting online publication.