


Russia and the Next Oil Crisis
Commodities / Crude Oil Jul 19, 2013 - 05:49 AM GMTBy: Clif_Droke

 On the global market scene, Russia has been one of the major laggards this year. The Market Vectors Russia ETF (RSX), a reflection of the country's stock market, fell 22% from its high earlier this year. RSX was testing a three-year low not more than a month ago and seemed to be in danger of breaking below this major long-term support.
Keeping in mind that the stock market is the single best barometer of future business and economic conditions, as per the old Dow Theory saw, things looked pretty bleak for Russia this summer...that is until the country caught a break from a major development in the commodities market.
Fortunately for Russia, the price of oil has been surging the last few weeks. Russia's economy is heavily influenced by the oil price due to the country's reliance on oil and gas production and exports. As goes the oil price, so goes the Russian economy, according to conventional wisdom. It's not surprising then to see Russia's stock market rally in response to the recent oil price spike.
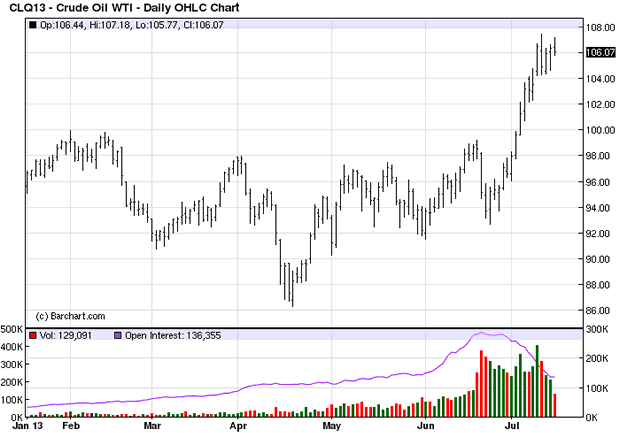
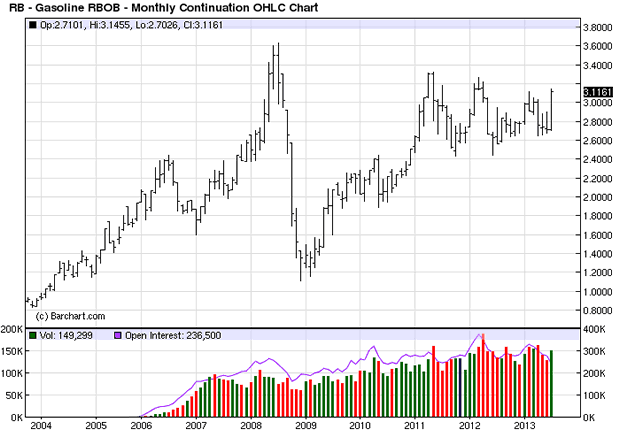
Russia's gain, however, is America's loss. As the price of oil rises, it makes the cost of all fuels from diesel to gasoline more expensive. In turn, as fuel costs rise the prices for all consumer goods eventually increase. The gasoline price is a major factor in the U.S. economy and whenever gas prices become excessive it has negative repercussions for consumers. Consider the long-term trajectory of the gasoline price since 2008: after the credit crash five years ago, the gas price has rebounded and isn't far from its previous all-time high.
The powers-that-be learned back in 1998 the folly of allowing oil prices to fall too low, for it nearly brought down Russia along with the rest of the global economy. Since then we've seen a global subsidization of the oil price to artificially high levels, and most particularly in the price of gasoline. Whenever things start to look bad for Russia, a rally in the energy markets always seems to come to her aid.
You may also recall that the high oil and gasoline prices of mid-2008 were the final catalyst that touched off the economic storm of that year. This isn't to suggest that a similar collapse is brewing, only that the bull market and economic recovery will eventually be imperiled if fuel prices are allowed to keep rising.
A couple of useful barometers to watch in order to gauge the extent of fuel price pressures on the economy are the stocks of FedEx Corp. (FDX) and United Parcel Service (UPS). FDX in particular is still holding up well, while UPS has taken a hit lately. Rising fuel costs always weigh on these two key economic indicators and if FDX and UPS start to flag this summer, we'll have a "heads up" that the fuel price increase will create problems for the economy.
Stock Market
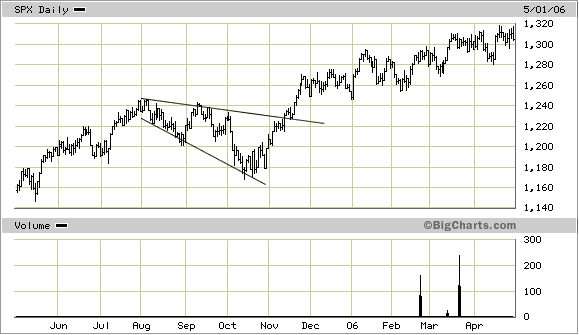
The story of the week was the new high in the S&P 500 Index (SPX). The comeback of the SPX was remarkably fast, though this isn't unusual given the historical tendency for the "megaphone" chart pattern visible in the index to bounce back quickly. Traders may remember a similar megaphone pattern in the SPX from the year 2005; like the current pattern, the megaphone of 2005 had a quick and violent turnaround (see chart below).
A similar pattern is playing out this time around with the S&P retracing all of its losses from the past few weeks and culminating in new all-time high.
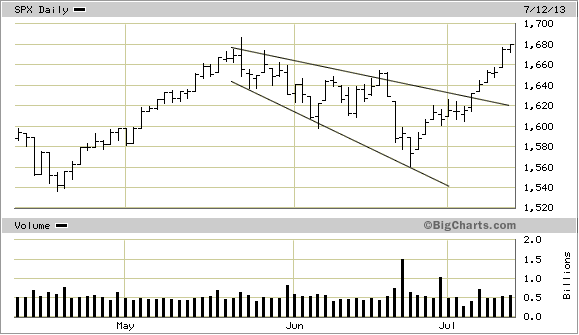
A liberal rendering of the pattern's boundaries (as I've drawn here), would give us an estimated upside target of around 1,720 - certainly within reach and not entirely out of the question. Already the 1,680 minimum upside objective has been exceeded.
Gold
My late mentor Samuel "Bud" Kress would often use the phrase, "He's caught up in his underwear," to describe an investment advisor who was forced to backtrack after making a blown market call. It would seem that the latest victim of "caught in the underwear" syndrome is the French investment bank Societe Generale.
You may recall that SocGen made an extremely bearish call on gold over a month ago. Back in June, two analysts with investment bank Societe Generale predict that the price of gold will be at $1,200 within the next three months. SocGen's Jesper Dannesboe and Robin Bhar maintained that continued selling of gold by ETFs, coupled with a lack of jewelry demand, would result in the next leg down for the yellow metal.
Dannesboe and Bhar wrote: "We believe that the dramatic gold sell-off in April, combined with the prospect of the Fed starting to taper its QE program before year-end, has resulted in a paradigm shift in many investors' attitude towards gold. This is likely to result in continued large-scale gold ETF selling this year and next. ETF gold selling has averaged about 100 tons per month since the April sell-off. We expect continued ETF selling to exceed higher demand for jewelry/bars and coins. Therefore, we have revised lower our Q4 13 gold forecast to $1,200/oz."
SocGen's Bhar was forced to offer an explanation for gold's recent bottom and mini-rally by stating in a report this week that gold's biggest backwardation since 1999 prompted a "corrective rally" and that strong physical gold demand and "nearby tightness" will persist for the "foreseeable future." SocGen added, however, that negative investor sentiment on the metal still translates into a bearish intermediate-term outlook. The bank also maintains that gold will average $1,150 an ounce for 2014.
In the short-term, at least, the long list of ultra-bearish investment banks are slowly lining up in the short-term bullish camp. The lesson here, as I stated in previous reports over the last few weeks, is that when the investment banks and research analysts all line up on the bearish side of the aisle, the market is virtually guaranteed to disappoint their short-term expectations.
2014: America's Date With Destiny
Take a journey into the future with me as we discover what the future may unfold in the fateful period leading up to - and following - the 120-year cycle bottom in late 2014.
Picking up where I left off in my previous work, The Stock Market Cycles, I expand on the Kress cycle narrative and explain how the 120-year Mega cycle influences the market, the economy and other aspects of American life and culture. My latest book, 2014: America's Date With Destiny, examines the most vital issues facing America and the global economy in the 2-3 years ahead.
The new book explains that the credit crisis of 2008 was merely the prelude in an intensifying global credit storm. If the basis for my prediction continue true to form - namely the long-term Kress cycles - the worst part of the crisis lies ahead in the year 2014. The book is now available for sale at: http://www.clifdroke.com/books/destiny.html
Order today to receive your autographed copy and a FREE 1-month trial subscription to the Gold & Silver Stock Report newsletter.
By Clif Droke
www.clifdroke.com
Clif Droke is the editor of the daily Gold & Silver Stock Report. Published daily since 2002, the report provides forecasts and analysis of the leading gold, silver, uranium and energy stocks from a short-term technical standpoint. He is also the author of numerous books, including 'How to Read Chart Patterns for Greater Profits.' For more information visit www.clifdroke.com
Clif Droke Archive |
© 2005-2022 http://www.MarketOracle.co.uk - The Market Oracle is a FREE Daily Financial Markets Analysis & Forecasting online publication.