Stock Market Valuation Very Expensive!
Stock-Markets / Stock Market Valuations Aug 02, 2013 - 02:55 PM GMTBy: PhilStockWorld
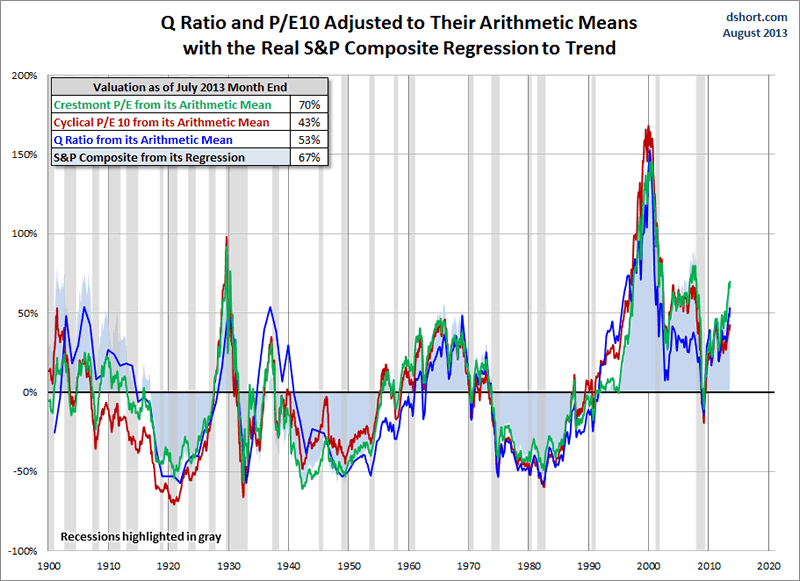
 Courtesy of Doug Short: Here is a summary of the four market valuation indicators I usually update during the first days of the month. The four indicators are:
● The Crestmont Research P/E Ratio (more)
● The cyclical P/E ratio using the trailing10-year earnings as the divisor
● The Q Ratio, which is the total price of the market divided by its replacement cost
● The relationship of the S&P Composite price to a regression trendline
To facilitate comparisons, I’ve adjusted the two P/E ratios and Q Ratio to their arithmetic means and the inflation-adjusted S&P Composite to its exponential regression. Thus the percentages on the vertical axis show the over/undervaluation as a percent above mean value, which I’m using as a surrogate for fair value. Based on the latest S&P 500 monthly data, the market is overvalued somewhere in the range of 43% to 70%, depending on the indicator. The latest data shows an increase in valuation from the previous month’s 39% to 66%.
I’ve plotted the S&P regression data as an area chart type rather than a line to make the comparisons a bit easier to read. It also reinforces the difference between the line charts — which are simple ratios — and the regression series, which measures the distance from an exponential regression on a log chart.

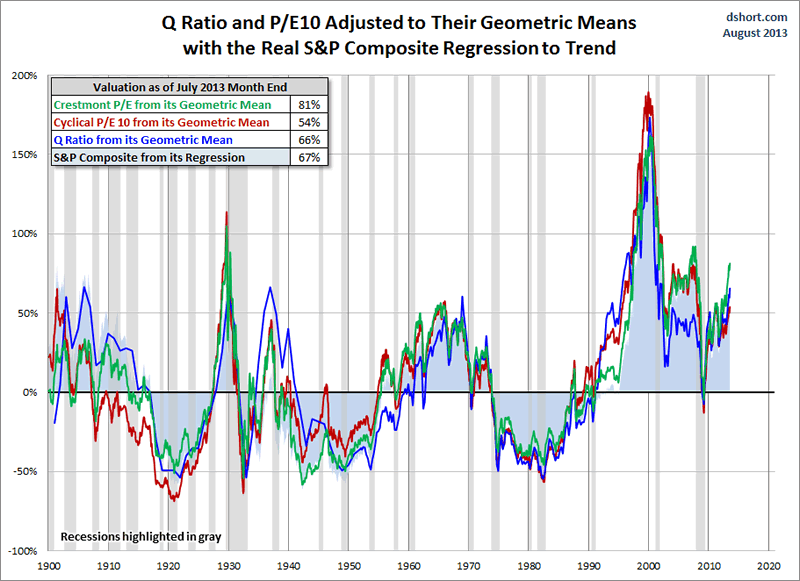
The chart below differs from the one above in that the two valuation ratios (P/E and Q) are adjusted to their geometric mean rather than their arithmetic mean (which is what most people think of as the “average”). The geometric mean weights the central tendency of a series of numbers, thus calling attention to outliers. In my view, the first chart does a satisfactory job of illustrating these four approaches to market valuation, but I’ve included the geometric variant as an interesting alternative view for the two P/Es and Q. In this chart the range of overvaluation would be in the range of 54% to 81%, an increase from last month’s 50% to 77%.

As I’ve frequently pointed out, these indicators aren’t useful as short-term signals of market direction. Periods of over- and under-valuation can last for many years. But they can play a role in framing longer-term expectations of investment returns. At present market overvaluation continues to suggest a cautious long-term outlook and guarded expectations. However, at the today’s low annualized inflation rate and the extremely poor return on fixed income investments (Treasuries, CDs, etc.) the appeal of equities, despite overvaluation risk, is not surprising. For more on that topic, see my periodic update:
Market Valuation, Inflation and Treasury Yields: Clues from the Past
- Phil
Philip R. Davis is a founder of Phil's Stock World (www.philstockworld.com), a stock and options trading site that teaches the art of options trading to newcomers and devises advanced strategies for expert traders. Mr. Davis is a serial entrepreneur, having founded software company Accu-Title, a real estate title insurance software solution, and is also the President of the Delphi Consulting Corp., an M&A consulting firm that helps large and small companies obtain funding and close deals. He was also the founder of Accu-Search, a property data corporation that was sold to DataTrace in 2004 and Personality Plus, a precursor to eHarmony.com. Phil was a former editor of a UMass/Amherst humor magazine and it shows in his writing -- which is filled with colorful commentary along with very specific ideas on stock option purchases (Phil rarely holds actual stocks). Visit: Phil's Stock World (www.philstockworld.com)
© 2013 Copyright PhilStockWorld - All Rights Reserved Disclaimer: The above is a matter of opinion provided for general information purposes only and is not intended as investment advice. Information and analysis above are derived from sources and utilising methods believed to be reliable, but we cannot accept responsibility for any losses you may incur as a result of this analysis. Individuals should consult with their personal financial advisors.
PhilStockWorld Archive |
© 2005-2022 http://www.MarketOracle.co.uk - The Market Oracle is a FREE Daily Financial Markets Analysis & Forecasting online publication.


