


Time for Caution, Stock Market Intermediate Top Within Days
Stock-Markets / Stock Markets 2013 Aug 05, 2013 - 04:52 AM GMTBy: Andre_Gratian

 Current Position of the Market
SPX: Very Long-term trend - The very-long-term cycles are in their down phases, and if they make their lows when expected (after this bull market is over), there will be another steep decline into late 2014. However, the severe correction of 2007-2009 may have curtailed the full downward pressure potential of the 40-yr and 120-yr cycles.
Intermediate trend - SPX continues to progress according to its structure. After a brief consolidation, the bull market has resumed its uptrend and has already created new highs in the leading indices.
Analysis of the short-term trend is done on a daily basis with the help of hourly charts. It is an important adjunct to the analysis of daily and weekly charts which discusses the course of longer market trends.
Daily market analysis of the short term trend is reserved for subscribers. If you would like to sign up for a FREE 4-week trial period of daily comments, please let me know at ajg@cybertrails.com
A TIME FOR CAUTION
Market Overview
After a period of indecision characterized by daily volatility, SPX finally broke above its former high, rising to 1709 on Friday. The DOW, Russell 2000 and NASDAQ 100 all followed suit, making new bull market highs. All this bullishness suggests a continuation of the long-term uptrend, but storm clouds are beginning to gather, especially in the breadth indicators. In the SPX, for instance, last week's new high was not confirmed by the daily A/D indicator. Also, price momentum is beginning to wane. The MACD is showing double negative divergence both in the daily and hourly charts, and even the weekly chart is showing negative divergence for the first time since the rally from 1343 started.
This does not necessarily mean that we are ready for an immediate reversal, although, for the SPX, 1709 was a phase projection which was met with an overbought SRSI, double negative divergence in the hourly MACD and strong negative divergence in the A/D oscillator. That would suggest that we are due for some consolidation, at least.
Structure: After an unorthodox minute wave I, wave ii consisted of a brief pull-back, and wave iii engineered the break-out to new highs. That's what it looks like until proven otherwise. But let's not forget that we are in minor wave 5 and intermediate wave V. For this reason, we may see an irregular pattern developing from this point on which could come to an end at any time.
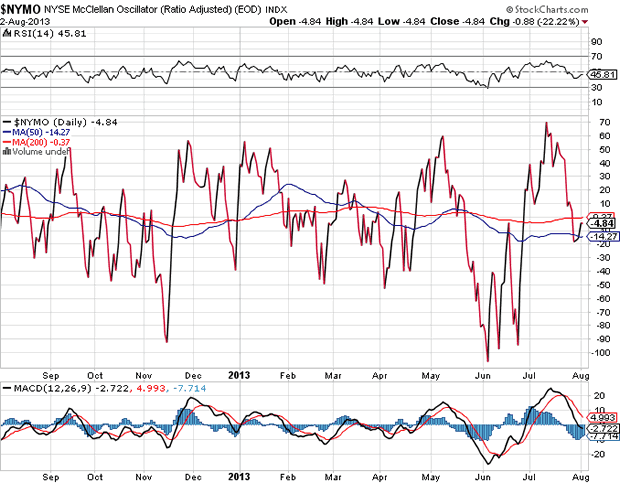
Breadth: Like my own breadth indicators, the McClellan Oscillator has pulled back to neutral and is staying there while the market is making new highs. This is typical behavior for the present market condition: an indication that we are very close to a top!
P&F and Fibonacci projections: The base pattern created around 1580, the re-accumulation pattern which formed around 1610, and the recent consolidation around 1685 all carry potential higher price projections. That does not guarantee that they will be reached. Each of the potential higher phase targets could turn out to be the one from which we start an intermediate decline. When a confirmed sell signal is given, it will be advisable to heed it since we could see the deepest market correction since last October.
Support/resistance zones: The first support is at 1700 and the next at 1694. Resistance levels are determined by the various P&F phase targets.
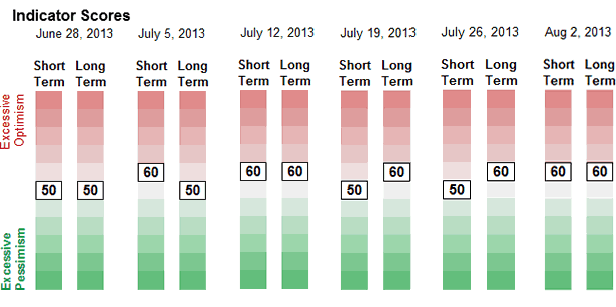
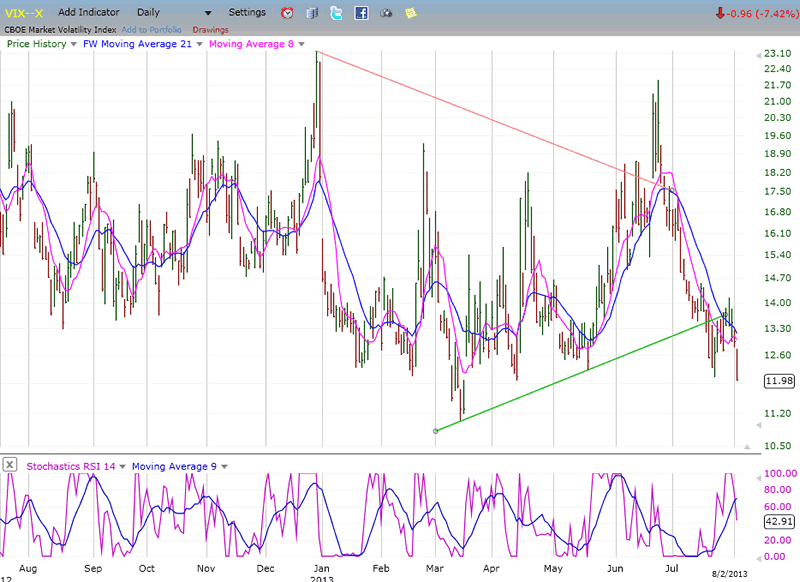
Sentiment: There is no change in the SentimenTrader long term indicator's reading of 60. VIX made a new low last week, and XIV a new high. Since we still don't see divergence developing with price, we can "assume" that the rally high has not yet been reached.
Chart Analysis
The following is a daily chart of the SPX (courtesy of QChart). It shows the uptrend which started at 1343 and its various phases, primarily determined by the 7-wk cycle. That uptrend moved in a well-defined channel until it came to an end at 1687, the completion of intermediate III. Intermediate IV brought about a correction which took the index out of its channel, and reversing it at 1560. The index has been moving higher in intermediate wave V ever since.
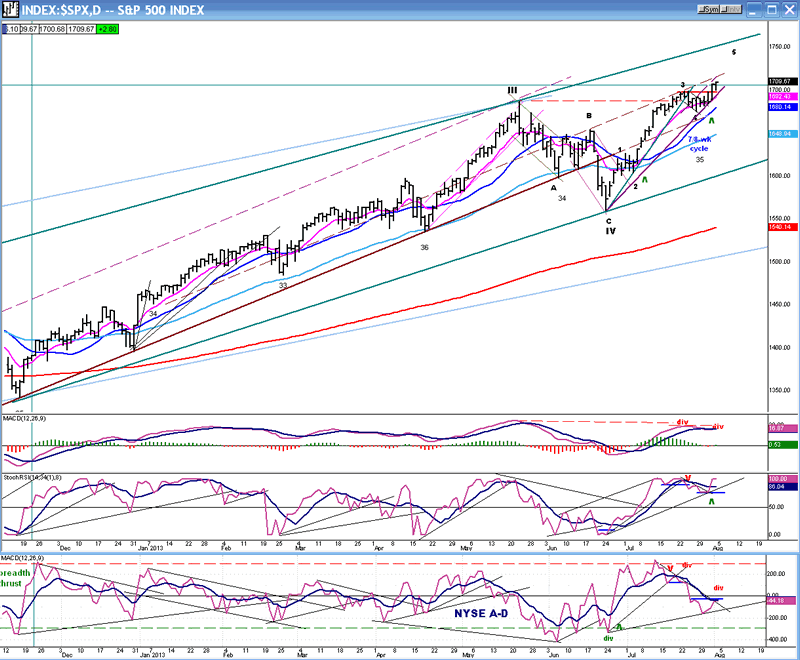
Wave 5 has subdivided into minor waves 1-2-3-4 and is currently in minor wave 5 which brought about an all-time high to the index on Friday, but could end at any time. If you want to know why, let's look at the indicators.
The middle-one (SRSI) is still strong, but overbought and should correct shortly. The other momentum indicator is the MACD (top). It is still strongly positive, but showing double negative divergence: the first with its 5/22 top, and the next with the recent top of 7/23. This puts it in a vulnerable position and it could turn down as early as Monday because of reasons that will be given when we look at the hourly chart.
But the weakest of all three indicators is definitely the A/D oscillator which is so weak that it has not even confirmed the move to a new high by the SPX. Unless we see a strong improvement in this indicator and in the MACD - something which is not likely - the top of intermediate wave V should come soon, perhaps in a matter of days.
The Hourly chart (also courtesy Q-Chart) of SPX is where deceleration in the uptrend really becomes obvious. Look at the move since minor wave 4 made its low (ostensibly minutes i-ii-iii...). It can't even reach the mid-point of its channel but, instead, is hugging the lower channel line. That is hardly a sign of strength but, instead, that of a rally which is hanging on for dear life. There is a good possibility that the lower channel line will be broken and that trading will continue outside of it for a day or two. When the index breaks below the green trend line, it will most likely keep on going.
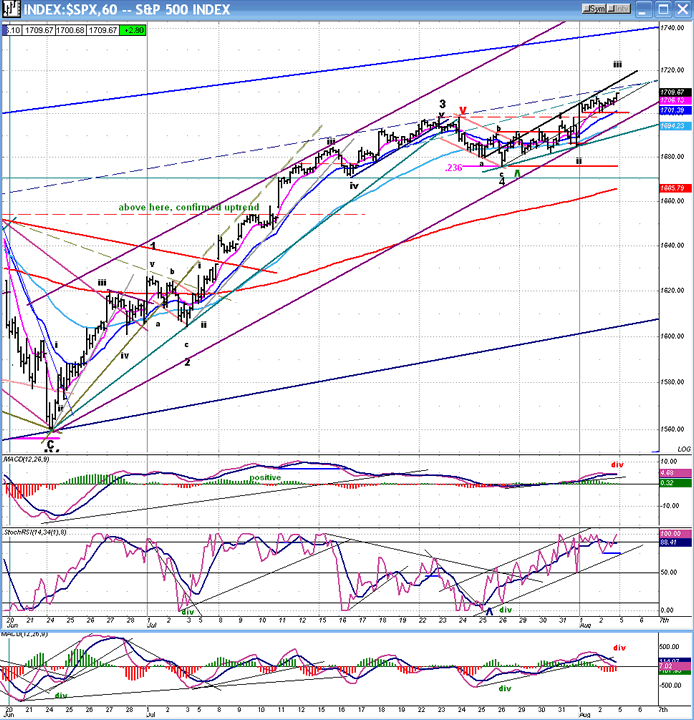
The indicators show essentially the same patterns as those of the daily chart. The middle one (SRSI) has crawled up to an overbought condition and can go no higher. Breaking its trend line will most likely correspond to a retracement in price.
The MACD, although not showing it as clearly, is also exhibiting double negative divergence. It, too, is still positive, but in this time frame, it would not take much weakness to put it into negative territory. As for the A/D oscillator at the bottom, it is already in a downtrend, ready to take the price with it as soon as it becomes negative.
I should also mention that although it, too made a new high, the Russell 2000 is becoming the weakest of the major indices. I normally leads the other indices.
Cycles
The 7/8-wk cycle has averaged between 33-36 trading days and has been responsible for determining the short-term corrections in the uptrend from 1433. This is a perfect example to illustrate the close correlation between cycles and EWT waves. Its low of a week ago defined minor wave 4. Considering the technical market condition it's very likely that by the time it makes its next low (in mid-September) it will help pin-point some corrective phase of the intermediate decline which will already be on its way.
In the meantime, an 11-wk cycle which could also correspond to the 33-wk cycle (the halfway point of the 66-wk cycle) is due a little past mid-august. It could turn out to be the high of the rally. Or, if a low, will cause the market to top a few days earlier. Should the latter turn out to be the case, the end of the rally will come even more quickly.
Breadth
The McClellan Oscillator and Summation Index appear below (courtesy of StockCharts.com).
I mentioned in the Market Overview that the McClellan oscillator has retraced from overbought to neutral, and is just sitting in place while the market makes new highs. This is a case of extreme negative divergence which does not bode well for a sustained rally. That is one of the reasons this article is entitled "A TIME FOR CAUTION".
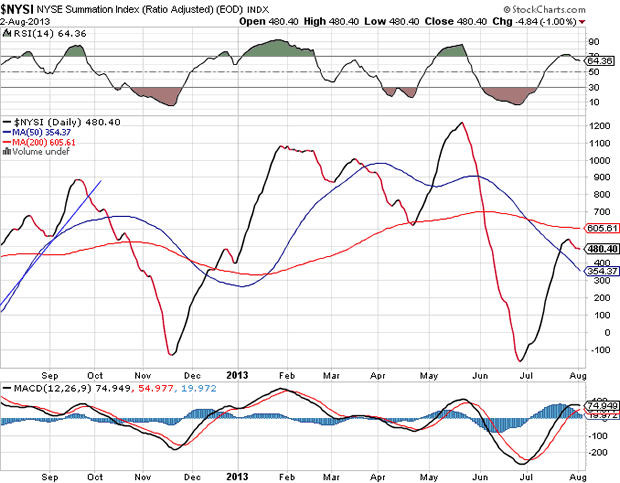
Negative divergence has been transmitted to the Summation index and all the indicators of both charts. That's as bad as it gets and it's time to stop thinking bullish - for a while!
Sentiment Indicators
The SentimenTrader (courtesy of same) now shows both indicators with a reading of 60. That could be a ray of hope that the market is still going higher. I expect that the long-term index will hit at least 70 before we have a top. Of course, that's not a sure thing and there are more sensitive indicators that will define the high. Those are the ones we should follow for guidance.
VIX
The VIX made a new short-term low last week. It retains positive divergence with the long-term low of March, but what we want to see to indicate an imminent market top is short-term divergence. At least, this has been the tendency in the past.
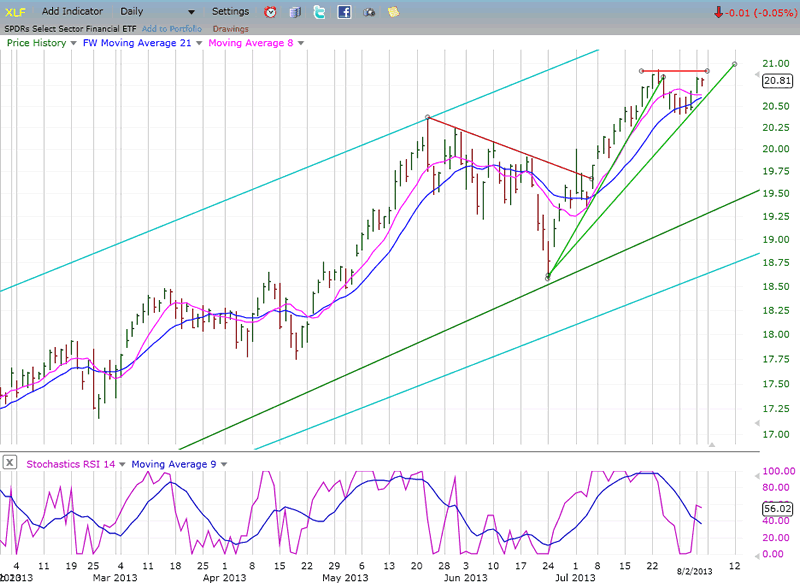
XLF (Financial SPDR)
Since the beginning of the rally, XLF has diverged briefly from SPX, only to catch up later and eliminate the divergence. This time could be different. The index has been lagging the SPX and has refrained from making a new high. The premise is that the financial index will lag the SPX at important tops. If this continues over the next few days, it will join the chorus of other yellow and red flags that are appearing in various indicators.
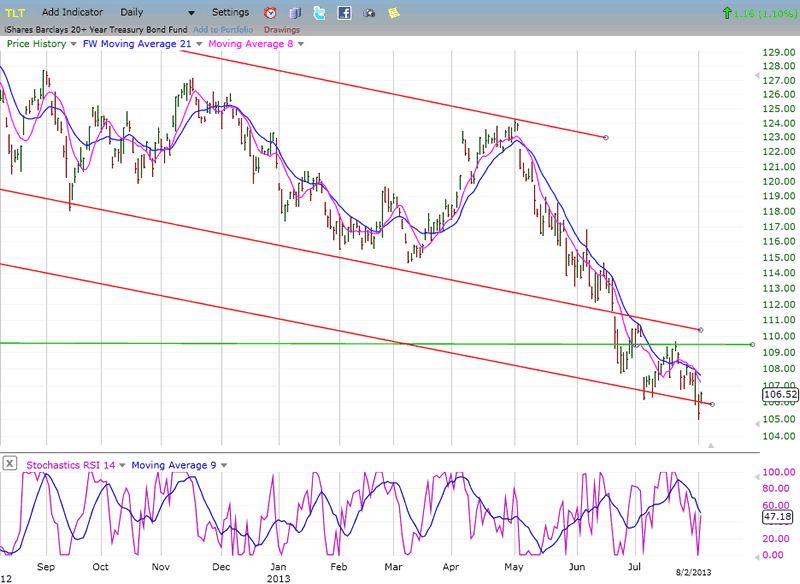
BONDS
TLT made another new low last week, but it rallied the next day to remain inside the lower channel line. There is some deceleration taking place in the rate of decline which may be a preview of a holding pattern followed by an attempt at a rally in a downtrend.
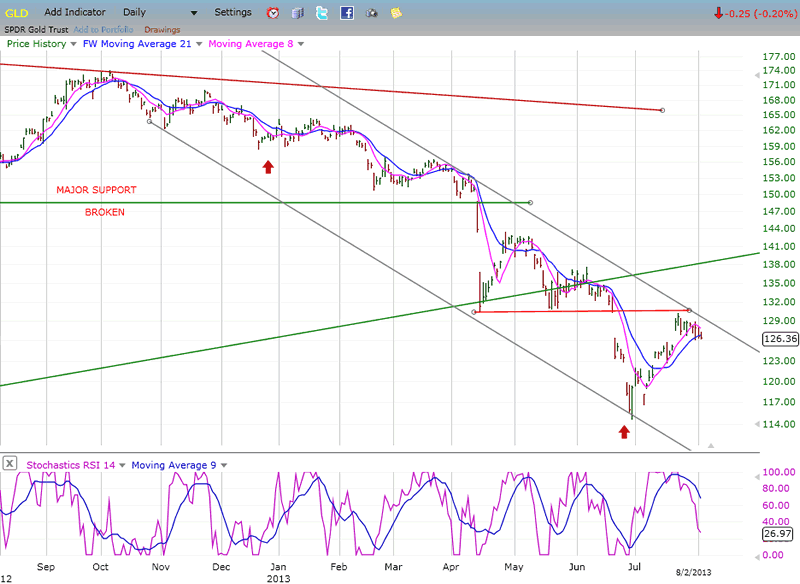
GLD (ETF for gold)
GLD has found resistance just below an important congestion level which happens to coincide with the top of its current declining channel. Will it be enough to turn prices down and into a continuation of the long-term downtrend? We'll see! What we know is that by dropping to the bottom of the long-term channel, the index has shown no tendency to decelerate its declining momentum. Normally, signs that the selling is abating are provided by the final low of a declining phase remaining above the bottom channel line. We should also remember that there is a good projection to 110 which may yet be filled. Finally, the rally could be construed as a wave 4 from the 1141 level. This is enough evidence that the long-term decline is still in effect, and to caution against expecting the resumption of a significant uptrend.
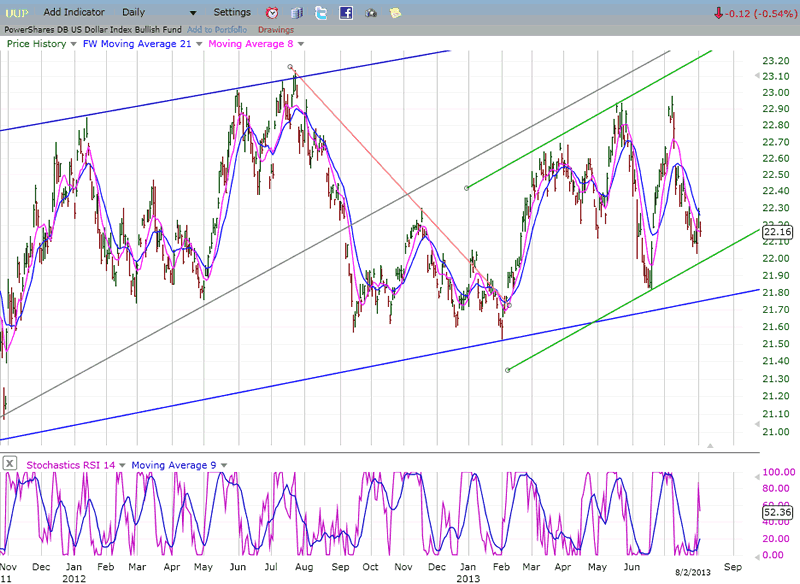
UUP (dollar ETF)
Over the short-term, UUP is not arousing interest in investors. It is "stuck" in a long-term accumulation base which should eventually develop into an important upside trend, but for now, except for a few short-term gyrations, the index remains contained in a trading range.
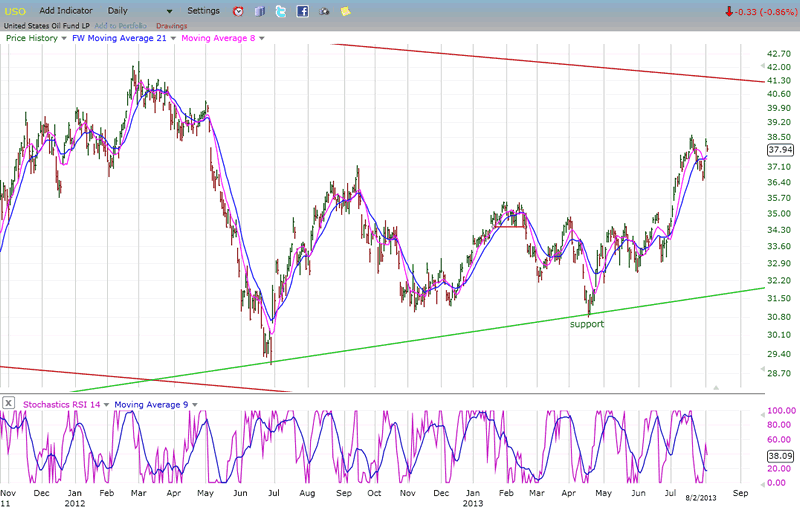
USO (United States Oil Fund)
By contrast to the former (UUP), USO has broken out of its consolidation base and into an uptrend which apparently has more to go if we are to believe the higher P&F projection. However, since there are signs that the market is just about ready to put in place an intermediate top, and since USO has a tendency to trade with the market, the near-term appreciation may be limited.
Summary
SPX is within days of finding an intermediate top. All indicators at the hourly, daily and weekly time frame are beginning to wave yellow and red flags. However, strong rallies do not die easily and, since there are several more potential price objectives which remain unfilled, it is possible that at least some of them will be attained before we begin a significant decline - deeper than any that have been seen in several months, but probably not the beginning of another bear market. It's a little too soon for that!
FREE TRIAL SUBSCRIPTON
If precision in market timing for all time framesis something that you find important, you should
Consider taking a trial subscription to my service. It is free, and you will have four weeks to evaluate its worth. It embodies many years of research with the eventual goal of understanding as perfectly as possible how the market functions. I believe that I have achieved this goal.
For a FREE 4-week trial, Send an email to: ajg@cybertrails.com
For further subscription options, payment plans, and for important general information, I encourage
you to visit my website at www.marketurningpoints.com. It contains summaries of my background, my
investment and trading strategies, and my unique method of intra-day communication with
subscribers. I have also started an archive of former newsletters so that you can not only evaluate past performance, but also be aware of the increasing accuracy of forecasts.
Disclaimer - The above comments about the financial markets are based purely on what I consider to be sound technical analysis principles uncompromised by fundamental considerations. They represent my own opinion and are not meant to be construed as trading or investment advice, but are offered as an analytical point of view which might be of interest to those who follow stock market cycles and technical analysis.
Andre Gratian Archive |
© 2005-2022 http://www.MarketOracle.co.uk - The Market Oracle is a FREE Daily Financial Markets Analysis & Forecasting online publication.