Is the Silver Bull Market Over?
Commodities / Gold and Silver 2013 Aug 07, 2013 - 06:08 AM GMTBy: Jason_Hamlin
 Precious metals had a strong month in July. But while gold was up 5%, silver advanced only 1%. A more recent reading of the past 30 days through August 6th, shows gold up 4.9%, while silver is up only 3.3%. This is an atypical relationship between the two metals, as silver usually leads gold higher (or lower). As the more volatile metal, silver is often up at twice the pace of gold during any given move.
I called this out in the latest edition of the Gold Stock Bull newsletter (Road Less Traveled Contrarian Report) and suggested this anomaly may be a warning sign that July’s strong performance in precious metals was a head fake or false breakout. The first few days of this week seem to be confirming this hypothesis.
While I have no intent to sell my physical metals or long-term core holdings, I do think gauging these short-term price fluctuations can be beneficial in determining when to add to positions or buy the dip. Calling a bottom in these markets is a fool’s game, but I believe we have most likely seen the worst for this correction in gold and silver. I have been buying in small tranches throughout the past few months, but have yet to fully commit and ‘back up the truck.’
Silver Technicals Improving
I take all technical analysis with a grain of salt, particularly in markets this manipulated and centrally planned. But a cursory examination of silver’s current conditions might be helpful in determining whether to buy, sell or hold on the recent weakness experienced over the past few days.
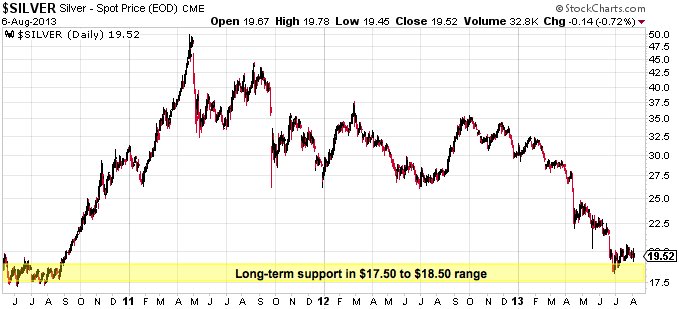
First is the longer term chart, which shows the incredible roller coaster ride in the silver price over the past three years. After the near hyperbolic move from $17.50 to $49, silver has now retraced 100% of that gain since the Summer of 2010. While it is commonplace to see a retracement of 50% or 60% of any major upleg, it is unusual to see a full 100% retracement such as the one silver has experienced in the past few years. This has many silver bulls throwing in the towel and has led several analysts to call an end to the bull market in precious metals.

But there are plenty of fundamental and technical indicators suggesting that the silver bull run is far from over. From a technical perspective, while silver’s decline from previous highs has been brutal, it has thus far been finding support around the important $18 level. This range of $17.50 to $18.50 is significant because this is the price range of the last major consolidation in the silver price, which lasted nearly a full year from October 2009 to October of 2010. This level was also resistance in the Spring and Summer of 2008 and this type of strong resistance over long time periods often turns into strong and lasting support. So as long as silver remains above $17.50, any calls of an end to the bull market are premature.
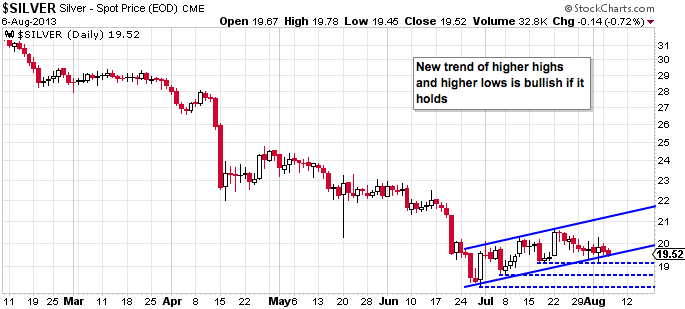
Zooming in closer to the most recent time period in the silver chart, we can see bullish developments. The silver price is creating some patters that we haven’t seen in the past year. Specifically, it has been generating higher highs and higher lows, which has created what could be the start of a new uptrend channel. We need a few more months of data to confirm this channel, but it is thus far bullish on the surface.

Silver has drifted lower over the past week and is now testing the bottom line of this new short-term trend channel. Silver bulls should watch closely for this line to hold, as any bounce will catapult silver towards $22 in short time. A drop below this trend line and silver still has a chance to hold above $19.30 before the technical trend fails. A hold above $19.30 and bounce higher would keep intact the series of higher lows that we have seen in the past month. If this level fails to hold, I think we will quickly see a re-test of previous lows around $18.50.
Silver Fundamentals Increasingly Bullish
On the fundamental side of things silver demand continues to be robust. Sales of bullion coins from the U.S. and Canadian mints are running at record levels and silver eagle sales are on pace to be over 50,000,000 coins in 2013, breaking the 2011 record of 39,868,500 silver eagle coins sold. In July alone, the U.S. mint sold 4.4 million silver eagles, which is nearly double the amount sold in July of 2012!
Furthermore, silver imports to India are surging to record levels. In the two months of April and May alone, silver imports to India equated to roughly the total annual production from the United States and Canada combined! In just the first 5 months of the year, India has already imported more silver than in all of 2012 and they are on pace to break the 2008 record for silver imports.
On the supply side of things, some of the largest precious metals producers are suspending operations at their mines due to lower metals prices and margin compression. This could very well lead to a decrease in annual silver supply for 2013 and into 2014. Even if prices recover by year end, the industry is likely to see restricted silver supply for the next few years due the suspension and closure of mining operations. Developing mines that were planning to come online will be delayed until prices recover and capital markets loosen up.
Conclusion
While the silver price has been absolutely smashed in the past two years and has failed to retake the $20 level recently, the technicals and fundamentals are turning increasingly bullish. I would never rule out another dip towards $18, particularly with the high amount of leveraged paper trading taking place. However, I expect any dip below this level to be very brief and met with an unprecedented amount of buying from bottom fishers.
With silver demand surging to record levels and supply tightening, one can only conclude that higher prices are on the horizon. Paper games might suspend fundamental laws of supply and demand in the short-term, but the markets eventually revert to equilibrium and some semblance of sanity. When this reversion occurs, I wouldn’t be surprised to see silver prices double within a matter of months.
I am not fully convinced of the recovery story we are being fed by the financial media, but if industrial demand picks back up and adds to the already powerful investment demand, the silver price and silver premiums are going to rocket higher.
I don’t advocate going ‘all in’ at this juncture, especially as technical support levels are being tested this week. But I think it makes sense to start buying in small tranches anywhere under $20. More conservative investors may prefer to wait for a bottoming pattern to be confirmed and some strong upside movement. Either way, I believe we are nearing the end of this protracted correction in the silver price and I suspect in a year from now investors will be wishing they would have bought more at the currently suppressed price levels.
Many of the stocks covered in the GSB newsletter have seen double-digit gains in the past month. There are several severely oversold mining companies trading at or below their book value, with the market giving them little or no credit for huge discoveries over the past few years. When precious metals start climbing back towards previous highs, I fully expect many of these stocks will be up multiples from current levels.
We have also been racking up huge gains in technology stocks this year, as energy, clean tech, critical metals, graphite, biotech, 3D printing and other sectors continue to be red hot. If you would like to view all of the stocks that we cover in the monthly newsletter, including technical analysis and fundamental rationale for picking up shares, please consider becoming a Gold Stock Bull Premium Member.
By Jason Hamlin
Jason Hamlin is the founder of Gold Stock Bull and publishes a monthly contrarian newsletter that contains in-depth research into the markets with a focus on finding undervalued gold and silver mining companies. The Premium Membership includes the newsletter, real-time access to the model portfolio and email trade alerts whenever Jason is buying or selling. You can try it for just $25/month by clicking here.
Copyright © 2013 Gold Stock Bull - All Rights Reserved
All ideas, opinions, and/or forecasts, expressed or implied herein, are for informational purposes only and should not be construed as a recommendation to invest, trade, and/or speculate in the markets. Any investments, trades, and/or speculations made in light of the ideas, opinions, and/or forecasts, expressed or implied herein, are committed at your own risk, financial or otherwise. The information on this site has been prepared without regard to any particular investor’s investment objectives, financial situation, and needs. Accordingly, investors should not act on any information on this site without obtaining specific advice from their financial advisor. Past performance is no guarantee of future results.
© 2005-2022 http://www.MarketOracle.co.uk - The Market Oracle is a FREE Daily Financial Markets Analysis & Forecasting online publication.


