


Important Stock Market Warning Signs
Stock-Markets / Stock Markets 2013 Aug 12, 2013 - 05:09 PM GMT

 George Leong writes:
With the summer months drawing to a close, it has been a somewhat warm few months for the stock market with the S&P 500 and Dow recently at record highs.
George Leong writes:
With the summer months drawing to a close, it has been a somewhat warm few months for the stock market with the S&P 500 and Dow recently at record highs.
Yet we are now seeing a pause, which may or may not be an indication that the current stock market rally has fizzled out after sizzling higher on the charts. Now, I would not be surprised to see a five-percent (or more) stock market correction.
In fact, I would love to see a stock market adjustment.
Some of the market leaders in 2012 and 2013 are beginning to fade, and this indicates a possible near-term stock market top.
The leadership of the banks is sliding. The chart of the Philadelphia Bank Index below shows the current situation of a potential bearish double-top forming in these stocks. Failing to attract support (at the bottom blue support line to the right of the chart) could see bank stocks drop lower on the charts, and they will take the broader market down with them.
Chart courtesy of www.StockCharts.com
We are also seeing some exhaustion in the previously sizzling housing market. (See “Why the Housing Market Is Eyeing the Fed’s Bond-Buying Strategy.”) The chart of the S&P Homebuilders Index below shows the current downward trendline after the index peaked in May. A closer look shows that a bearish descending triangle may be in the works, which could see the housing sector stocks fall through the lower support line.
Based on my technical analysis, and as I have said in previous commentaries, I would be very careful about chasing housing stocks higher. The easy money in this sector has already been made.
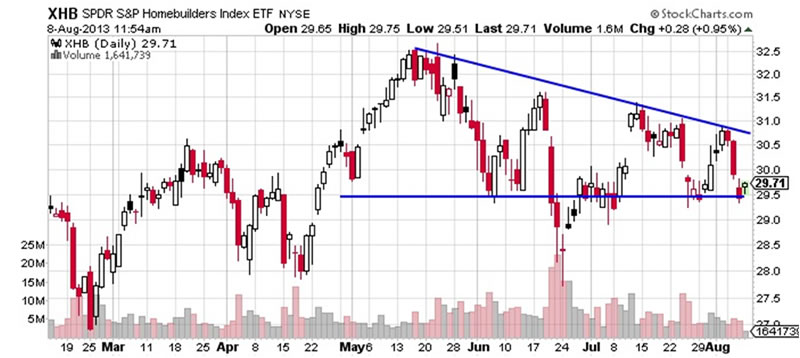
Chart courtesy of www.StockCharts.com
The S&P 500 also looks a bit tired following its breakout in early July, as shown by the blue circle in the chart below. The index is hesitating and moving sideways. A retrenchment could drive the index back below the horizontal support level.
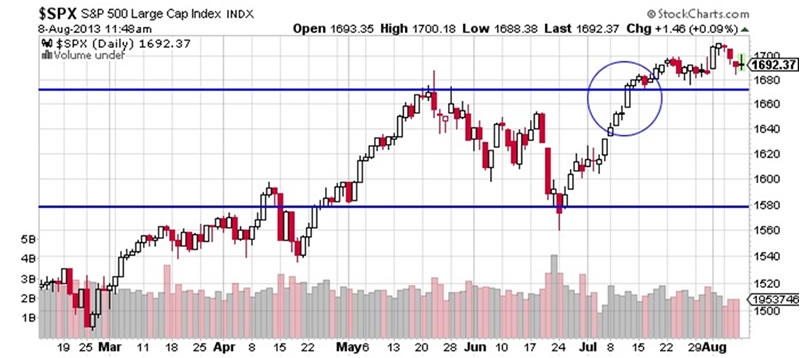
Chart courtesy of www.StockCharts.com
Now, look at the chart of the Chicago Board Options Exchange (CBOE) Volatility Index (VIX). The chart shows traders are calm and relaxed with little fear of what could happen. The last time the VIX was this low was back in 2007, and we all know what followed shortly thereafter: the Great Recession in 2008.
Chart courtesy of www.StockCharts.com
Complacency in the stock market is often a death wish that could result in a disastrous end. Don’t get too relaxed at this time, or you could find yourself singing the blues from the sidelines very soon.
So while the stock market could edge higher, these four negative charts shown above suggest to me that there could be a relapse on the horizon.
George Leong, B.Comm.
http://www.profitconfidential.com
We publish Profit Confidential daily for our Lombardi Financial customers because we believe many of those reporting today’s financial news simply don’t know what they are telling you! Reporters are trained to tell you the news—not what it can mean for you! What you read in the popular news services, be it the daily newspapers, on the internet or TV, is the news from a “reporter’s opinion.” And there’s the big difference.
With Profit Confidential you are receiving the news with the opinions, commentaries and interpretations of seasoned financial analysts and economists. We analyze the actions of the stock market, precious metals, interest rates, real estate and other investments so we can tell you what we believe today’s financial news will mean for you tomorrow!
© 2013 Copyright Profit Confidential - All Rights Reserved
Disclaimer: The above is a matter of opinion provided for general information purposes only and is not intended as investment advice. Information and analysis above are derived from sources and utilising methods believed to be reliable, but we cannot accept responsibility for any losses you may incur as a result of this analysis. Individuals should consult with their personal financial advisors.
© 2005-2022 http://www.MarketOracle.co.uk - The Market Oracle is a FREE Daily Financial Markets Analysis & Forecasting online publication.