


Inflation - Deflation Confusion, Financial Reality Hidden By Commonly Used Theory and Jargon
Economics / Inflation Aug 21, 2013 - 05:39 PM GMTBy: Dan_Amerman

 As we will explore in this analysis, when we look at two of the largest sources of net worth in the United States – housing and stocks – then what history shows us is that for 22 out of the 40 years between 1972 and 2012, much of the truth about financial performance has been almost invisible to people who have been relying on the most commonly used definitions for inflation and deflation.
That is, most people phrase the question as being one of either a) inflation, or b) deflation, meaning it has to be one or the other and obviously can't be both together. As we will explore using simple to follow, round number examples, taking this seemingly common sense approach leaves us unable to distinguish between a 20% gain, a 20% loss and a 94% loss.
We will then apply the type of methodology used by some of the most sophisticated investors in the world, which splits changes in the value of assets from changes in the value of money. When we take this step, then the possible answers are no longer limited to either A) inflation or B) deflation, but expand to also include C), both inflation and deflation occurring at the same time.
As we will discover, for the largest sources of household net worth during the 22 years analyzed out of a 40 year period – the answer was indeed c) both inflation and deflation, at the same time. Thus, the past didn't work the way most people think it did.
And there are compelling reasons to think that this third possibility of simultaneous inflation and deflation may also define the path ahead of us. If so, those who rely on the most common definitions for inflation or deflation may be unnecessarily placing themselves at risk, simply because they don't fully anticipate the third possibility, which historically speaking, also happens to be the most common outcome for stressed economic conditions.
Theoretical Economics Perspective
Let's start with Economics 101, where the definitions of inflation and deflation are fairly straightforward.
Inflation is an increase in the money supply.
Deflation is a decrease in the money supply.
It would seem fairly straightforward, then, that we can't have both inflation and deflation at the same time, so therefore it must be one or the other.
Unfortunately, that's where the straightforward part ends. Just what does “money supply” mean anyway? Is it M1? Is it M2? Is it M3? What about credit? What about the value of real estate and other assets? (And for the average person – what do those "Ms" mean anyway?)
Once you have (somehow) picked a definition for “money supply”, what are the practical implications for you and your savings? Unfortunately, that's another problem with these theoretically correct definitions of inflation and deflation. Any linkage between that commonly accepted definition of inflation and actual price levels is, well, highly theoretical. Some economists write papers saying one thing, then others write papers disagreeing with them – it’s the perfect subject for endless debates, because it’s unsolvable.
An even more dangerous problem can be found when we look at the typical "inflation versus deflation" debate, as if those were the only two choices. For instance, if we look at an asset like a house or a share of stock, then an increase in price means inflation, and a decrease in price means deflation. Again – by the common definition – we can't have both inflation and deflation at the same time; therefore it obviously must be one or the other.
Finance & Applied Wealth Management Perspective
Now let's move from theoretical economics to investment decisions in the real world. One of the core principles that permeates professional finance is that a dollar isn't a dollar, not at different points in time.
To make real-world investment decisions, we use rates to compare dollars at those different points in time.
We usually incorporate inflation into our discount or compounding rates – at least implicitly.
The most common number that we use to represent inflation is the change in price levels, such as changes in the price of groceries. To capture a broad spectrum of price level changes, the consumer price index (CPI) is often used.
So from a Finance perspective – the perspective of applied wealth management for the most sophisticated investors in the world – I think it's fair to say that the norm is using price inflation rather than some theoretical money supply change that's too ambiguous to ever pin down. What’s the difference for you between these two definitions? And why should you care?
The Price Of Blindness
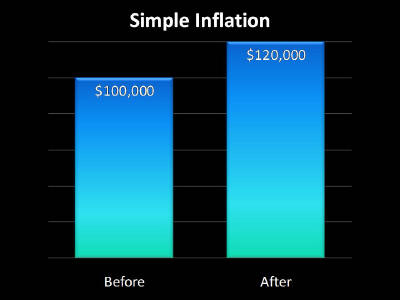
We’ll start with the Econ 101 perspective. The money supply, however we define that, went up. More money sloshing around the economy means prices rise. Our asset was worth $100, now it’s worth $120, so if we restrict our choices to only inflation or deflation, then by definition that’s inflation. And that’s pretty much all we know.
Now, let’s come in from a practical finance perspective. We started with a $100,000 asset, and we end up with a $120,000 asset. This asset could be a house, stocks, comic books, whatever you want it to be.
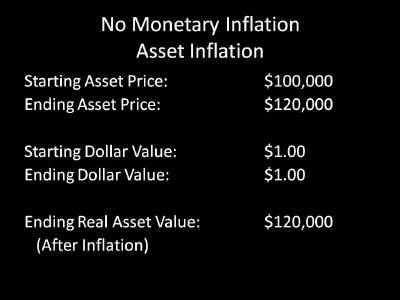
In this example, the dollar doesn’t change in value.
Since a dollar started out being worth a dollar, and ended up being worth a dollar, we end up with an asset worth $120,000.
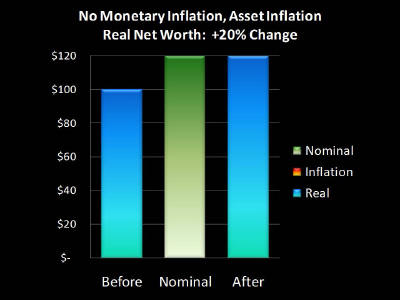
That means our net worth went up 20%, as shown on this graph. That’s great!
However, what if we define inflation not in terms of money supply, but well, changes in what a dollar will buy for us? After all, isn’t that the part of inflation that most people care about? What it costs to, well, buy things?
Changing The Value Of A Dollar

OK, we have exactly the same situation, from an Econ 101 perspective. We start with an asset price of $100,000, and end with an asset price of $120,000. Indistinguishable from our previous example.
Only this time we have inflation in the sense that most people mean it. A dollar becomes worth only 67 cents, in purchasing power terms. So, if we can sell our asset for $120,000, but each of those dollars in the future will only buy what 67 cents will today, what’s the real value of our asset? It has actually dropped to $80,000.
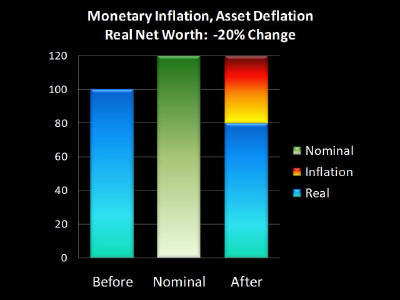
So when we look at our graph, the left bar shows our starting asset of $100,000, and if we consider only the ending number of dollars, then the middle bar of $120,000 would seem to indicate that there was a $20,000 profit. But when we account for each of our dollars only being worth 67 cents in purchasing power terms, the real value of our asset is only $80,000. The difference between the $80,000 and $120,000 is the fire of inflation.
When it comes to the purchasing power of the asset – which is what really matters – our asset experienced 20% asset deflation. Our loss was hidden by the dollar experiencing inflation, and losing a third of its purchasing power. In otherwords, the loss in the value of our money actually hid the loss in the value of our asset. But this combination of simultaneous inflation and deflation can only be seen if we split the valuation of money from the valuation of assets.
So when we use the most common way in which people look at inflation and deflation, which is to say it has to be either one or the other and can't be both simultaneously, then we’re unable to tell the difference between a 20% gain and a 20% loss. Interesting, and also a bit troubling.
And this becomes even more troubling if a dollar were to become worth a lot less than 67 cents over say, the next 10-20 years. Many people are quite understandably worried about a much higher and more dangerous degree of inflation due to the combination of the extraordinary level of federal budget deficits, the Federal Reserve creating trillions of dollars out of thin air, and the skyrocketing cost of paying for Social Security and Medicare as the Baby Boom generation retires.
High Rates Of Simultaneous Inflation & Deflation
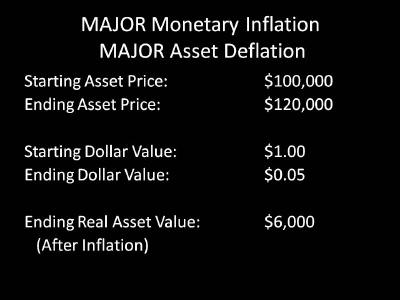
OK, exact same situation, from an Econ 101 perspective. Starting asset price of $100,000, ending asset price of $120,000.
Only this time, a dollar ends up being worth only five cents.
If we can sell our asset for $120,000, but each dollar is only worth five cents, what happens to the real value of our asset, i.e. what it will buy for us? It plummeted all the way down to $6,000.
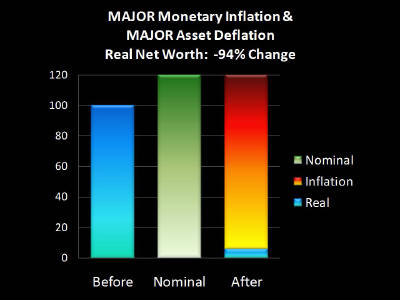
Our left and middle bars are just the same, but look at our right bar now. That $120,000 is almost all inflation, because we lost 94% of our net worth. We lost 94% of the value of our asset, which is massive asset deflation in purchasing power terms, but it was entirely hidden by the even larger 95% destruction of the value of the dollar.
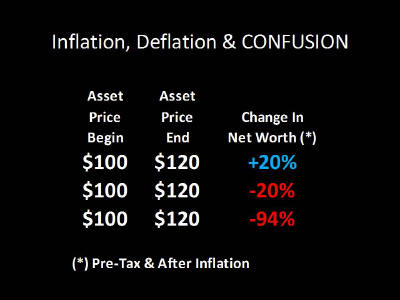
Three scenarios. In every case, we start with the same price, and we end with the same price, yet we have three radically different outcomes in our net worth. Now, if you take what some people consider to be the smart route of using the theoretical economics definition of changes in money supply – those outcomes will be impossible to tell apart. Or, if we restrict ourselves to assuming it has to be either inflation or deflation - then it is inflation in each case, and we also can't tell the difference.
However, if we use a methodology created specifically for practical, real world investment decisions – then these differences become boldly obvious.
So does this mean that only finance people have a clear vision for what's happening, and that all those economists have no idea? Of course not, that would be absurd.
Because here's the other thing you’ve got to keep in mind about our Econ 101 definition of inflation as being changes in the money supply. Economists don't use it either – not once something concrete and tangible needs to be done, such as calculating the growth of the national economy, or changes in productivity. For these types of practical calculations, ambiguous theory doesn't hack it, and thus economists also use changes in price levels, much like the finance people.
Unfortunately, many millions of people are paying a very real penalty for this clash of theory and jargon.
Real World Theory & Jargon Price 1: Blindness
The first price is that if you or your advisor can’t see the difference between gaining 20% and losing 94% because of the definition you choose – then you are investing blind. If you can’t even see what is happening, then your only hope for success is pure luck.
Real World Theory & Jargon Price 2: Confusion
The second price is confusion, and this one is affecting many millions of people right now. Given the issues with the economy and economic growth in the US and throughout the world, many thoughtful people are interpreting this to mean that the future is one of deflation. And because they assume it must be either inflation or deflation, then implicitly, the economic troubles that may create a long term environment of asset deflation, somehow therefore protect the value of money, so investors no longer have to worry about inflation.
This definition-based and overly-simplistic belief is dead wrong and profoundly dangerous for investors. When a nation gets into economic trouble, and it has a symbolic currency like the current US dollar, then simultaneous monetary inflation and asset deflation are the norm, and we have multiple examples of this in the United States in recent decades.
Let's start by taking a look at the stock market in recent years.
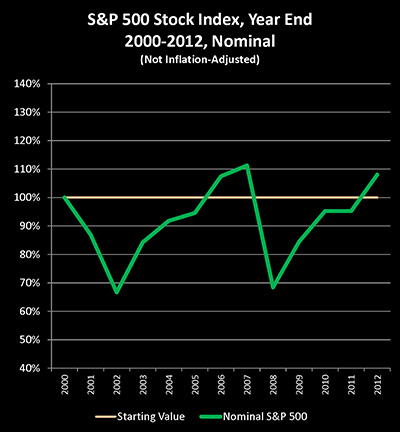
The Standard & Poor's 500 stock index bounced around quite a bit between the end of the year 2000 and the end of 2012, but the end result was an 8% gain over those 12 years. So if we restrict ourselves to saying it has to be either inflation or deflation, we have 8% asset inflation.
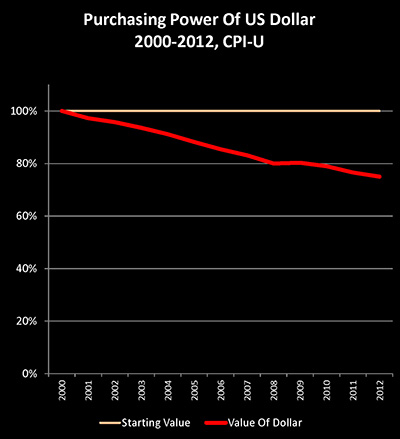
Until, that is, we adjust for the changing purchasing power of the US dollar. And if we take the Consumer Price Index as calculated by the US government, then a dollar by the year 2012 only had a purchasing power of 75 cents when compared to a dollar in the year 2000.
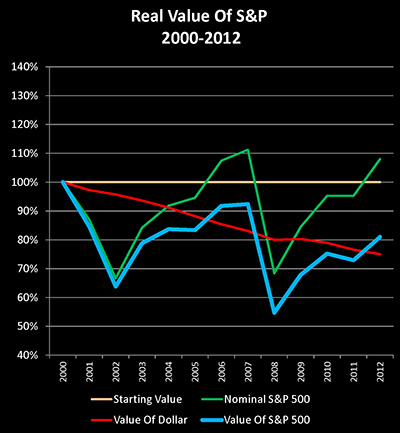
So when we look at historical prices for the S&P 500 (the green line), and we adjust for the falling value of the US dollar (the red line), we get a quite different picture for what happened to the purchasing power of the S&P 500 – and to US stocks in general – between the end of the year 2000 and 2012. In real terms, which is to say in purchasing power or inflation-adjusted terms, the stock market fell by 19% over this 12 year period (the blue line).
When we look at what assets will buy for us, then we experienced asset deflation of 19%. This asset deflation, or loss in value of the assets, was entirely hidden by the 25% destruction of the purchasing power of the dollar, i.e. inflation. And in the real world, we saw a combination of asset deflation and price inflation that could not be seen using theoretical definitions of the money supply, nor could it be seen if we had restricted ourselves to having either inflation or deflation, as is commonly done.
Housing, Stocks & 22 Years Of Simultaneous Inflation & Deflation
The second half of the article is linked below. Using the methodology established in the first half, we review the housing market from 2000 to 2012, the stock market from 1972 to 1982, and the housing market from 1972 to 1982. We explore:
Why the path taken by the housing market since 2000 is quite different from what most people think.
How the largest bout of asset deflation in modern US financial history was covered over almost entirely by the largest destruction of the purchasing power of the US dollar.
Why what millions of people would tell you is the best investment they made in their lives - didn't quite work the way they thought it did.
Daniel R. Amerman, CFA
Website: http://danielamerman.com/
E-mail: mail@the-great-retirement-experiment.com
Daniel R. Amerman, Chartered Financial Analyst with MBA and BSBA degrees in finance, is a former investment banker who developed sophisticated new financial products for institutional investors (in the 1980s), and was the author of McGraw-Hill's lead reference book on mortgage derivatives in the mid-1990s. An outspoken critic of the conventional wisdom about long-term investing and retirement planning, Mr. Amerman has spent more than a decade creating a radically different set of individual investor solutions designed to prosper in an environment of economic turmoil, broken government promises, repressive government taxation and collapsing conventional retirement portfolios
© 2013 Copyright Dan Amerman - All Rights Reserved
Disclaimer: This article contains the ideas and opinions of the author. It is a conceptual exploration of financial and general economic principles. As with any financial discussion of the future, there cannot be any absolute certainty. What this article does not contain is specific investment, legal, tax or any other form of professional advice. If specific advice is needed, it should be sought from an appropriate professional. Any liability, responsibility or warranty for the results of the application of principles contained in the article, website, readings, videos, DVDs, books and related materials, either directly or indirectly, are expressly disclaimed by the author.
© 2005-2022 http://www.MarketOracle.co.uk - The Market Oracle is a FREE Daily Financial Markets Analysis & Forecasting online publication.