


Stock Market Fractured Decline
Stock-Markets / Stock Markets 2013 Aug 26, 2013 - 05:24 PM GMTBy: Andre_Gratian

 Current Position of the Market
SPX: Very Long-term trend - The very-long-term cycles are in their down phases, and if they make their lows when expected (after this bull market is over), there will be another steep decline into late 2014. However, the severe correction of 2007-2009 may have curtailed the full downward pressure potential of the 40-yr and 120-yr cycles.
Intermediate trend - SPX and some other indices have formed a H&S top which was confirmed with last week's sell-off. A back-test of the neckline is possible over the near-term.
Analysis of the short-term trend is done on a daily basis with the help of hourly charts. It is an important adjunct to the analysis of daily and weekly charts which discusses the course of longer market trends.
Daily market analysis of the short term trend is reserved for subscribers. If you would like to sign up for a FREE 4-week trial period of daily comments, please let me know at ajg@cybertrails.com
A FRACTURED DECLINE
Market Overview
The first leg of what is purported to be an intermediate decline was marked by various degrees of weakness in the major averages. The DOW industrials was, by far, the weakest, while the NASDAQ Composite looks as if it is only consolidating in preparation for making a new high. Looking at the price action, of course, is important. However, the breadth indicators of the NYA and the NQ look virtually the same, which means that in spite of their relative price difference, the two indices are showing the same degree of internal weakness. In fact, an article published by the SentimenTrader on 8/19 states that: "The underlying breadth of the stock market has been weak, and it's gotten so bad that it is extreme on a historical scale." So, should we believe the price action of the DOW or that of the NASDAQ?
SPX and RUT both made H&S tops which was subsequently confirmed by the price action. I had expected the traditional rally back to the neckline, which is what the indices may be in the process of doing. RUT has almost reached its neckline, but SPX is still a long ways away and may not even come close before turning down again. With the hourly momentum indicators overbought and the A/D oscillators showing negative divergence as of Friday's close, next week has a good chance of bringing additional weakness to the market.
Structure: For all indexes, except perhaps the QQQ, intermediate wave A of major 4 appears to be underway. It is unclear if wave B has already started, or if the two-day rally is still part of A. Next week should bring some clarification.
Breadth: As I stated above, recent weakness in breadth has been of historic proportion. It has recovered over the past few days but, by Friday, was again showing some divergence to price.
P&F and Fibonacci projections: SPX found support at 1640, shy of a lower projection. We'll see if that support continues to hold long enough for the budding rally to continue.
Support/resistance zones: The indices found support at individual support zones. This preference was well illustrated by the DOW which fell far beyond its 55-DMA while QQQ held above it. The same is expected for resistance levels.
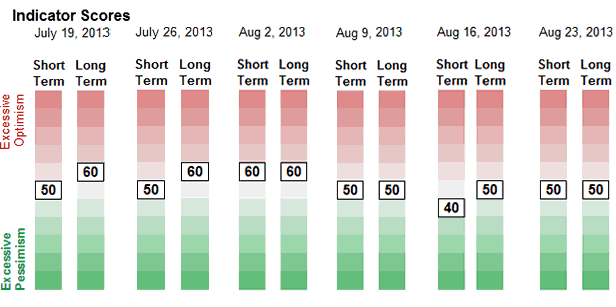
Sentiment: the SentimenTrader long term indicator remains uncommitted at a neutral 50. I expect it to dip lower by the time the decline has completed its course.
Chart Analysis
While SPX is not representative of all the indices, it is a good average of them all, so I will stick with it as the best chart to analyze (courtesy of QChart)
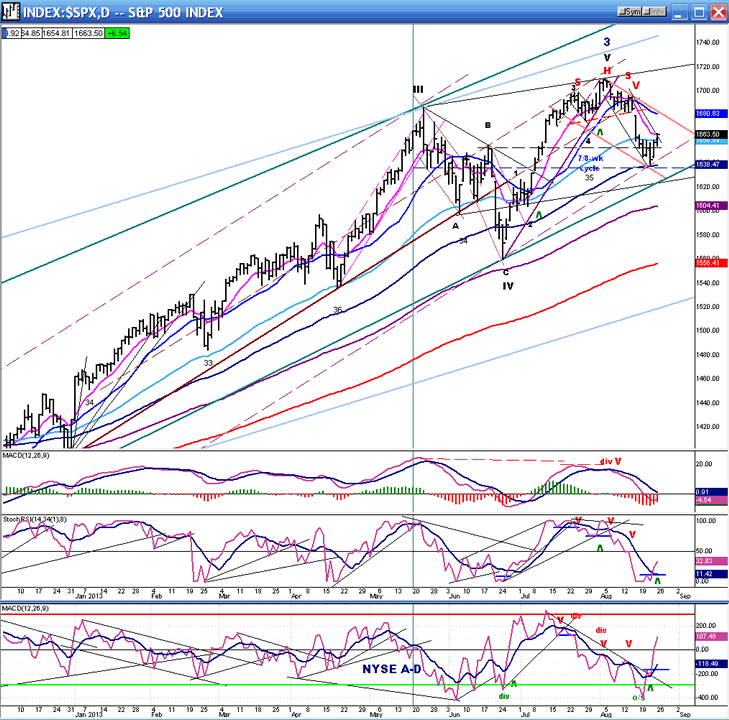
I have labeled the top as major wave 3, because it is the most probable current structure. If so, the correction should continue as it did for intermediate wave III, in a large A-B-C pattern. What we must decide, right now, is whether or not wave A has already been completed. On the initial decline, the index went past the 55-DMA (light blue) and Wednesday, found support on the 89-DMA. Thursday and Friday produced a 25-point bounce which brought the index back above its 55-DMA.
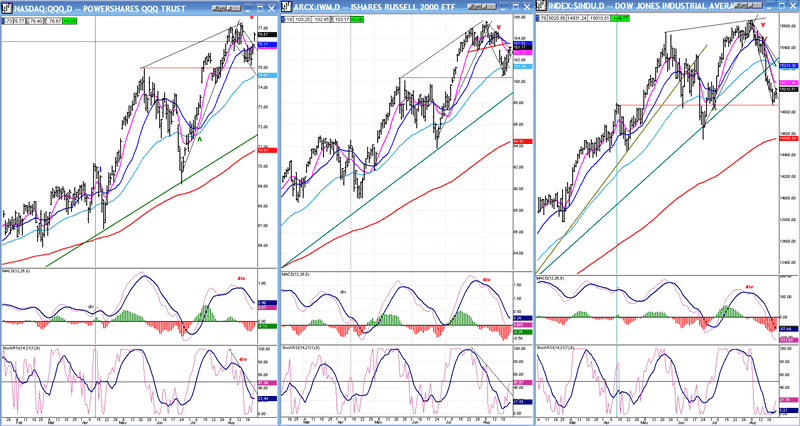
In order to confirm that we have started wave B of the decline, we will need to extend the bounce into a rally, and next week the market will have a chance to show if it is capable of doing this. Now would be a good time to examine each index separately to see if that's in the cards! Below is a display of the QQQ, IWM, and Dow side by side.
A quick glance at all three shows that the DOW is by far the weakest. It was the first to peak and it has far surpassed the others in its correction. The thin red line shows that both QQQ and IWM found support at their May peaks. DJIA, on the other hand, dropped to the April high. Will the two indices on the left catch up with it in the days and weeks ahead, or will they manage to transfuse some of their strength into the Dow? Perhaps the bias leans in favor of the first option, and here is why: I mentioned earlier that breadth has been exceedingly weak in the past few weeks with the DOW best reflecting that condition. Perhaps all we are getting is an oversold breadth rally, but it has hardly benefited the Dow!
QQQ was undoubtedly affected by the strength in AAPL which started a powerful countertrend rally at the same time as the index was starting its late June up-phase. There are now indications that AAPL may be ready to start a correction and this should also have an effect on QQQ's performance.
IWM made a clean H&S top before it broke its neckline. It is entirely possible that it is presently rallying to the neckline (a fairly common process). If so, it could turn down at any time and resume its decline.
This reasoning is certainly worth considering. In addition, Friday ended with negative divergence in the hourly indicators and very overbought SRSIs, both of which call for a short-term reversal. If one starts, let's see if it picks up momentum on the downside. If it does not, it will mean that we will probably extend the rally which started last Thursday and this will increase the possibility of having wave B already underway.
Cycles
It looks as if the 33-wk cycle (which is actually an 11-wk cycle) has bottomed on time and is the cause of the current bounce. If superior forces are pushing down, the rally could be short-lived.
The next 7/8-wk cycle low in due in mid-September.
Breadth
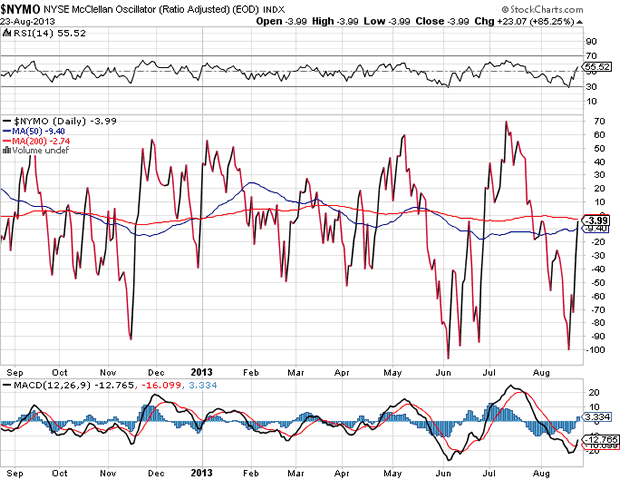
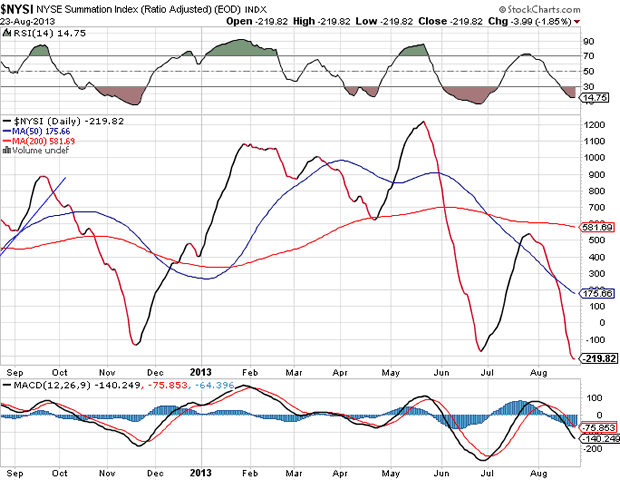
The McClellan Oscillator and Summation Index appear below (courtesy of StockCharts.com).
I mentioned earlier that we might only be getting an oversold bounce in the breadth indicators. Look how similar the last two declines were in the McClellan oscillator. They started from about 60/70 and dropped straight down to minus 100. This was followed by a rebound to the zero line. Will the similarity continue? If so, we should expect additional weakness and a re-test of the low before the end of correction. However, it is unlikely that the two patterns will continue to be exactly alike and develop in the same time frame because a significant difference lies in the pattern which is being made by the NYSI. After showing significant divergence at its recent high, it has now made a new low, which is also a continuation of the negative divergence pattern. Shouldn't some strength return and become evident in this indicator before the market can find a low?
Sentiment Indicators
The SentimenTrader (courtesy of same) long term indicator has dropped from the slightly elevated reading of 60 back to a neutral 50 since the decline started.
I would expect that a reading of 40 would be appropriate to suggest that the correction is coming to an end.
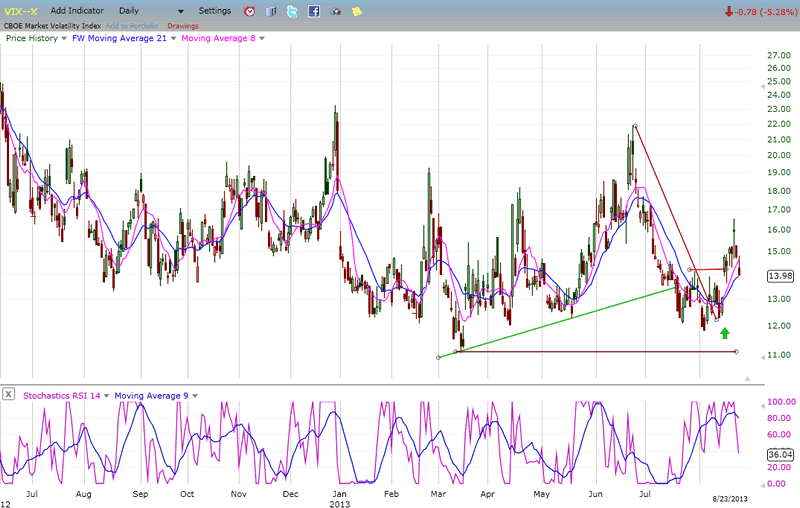
VIX
VIX is in reverse sync with SPX and has no short-term forecasting value at this time. In order to do so, it would have to show either relative strength or weakness with SPX. At its recent low, VIX did show considerable relative strength to the SPX by rising from its March low until May, while the index was also in an uptrend. The fact that it held that low while SPX went on to make an all-time high may have some longer term significance. If so, this should show up in the days and weeks ahead.
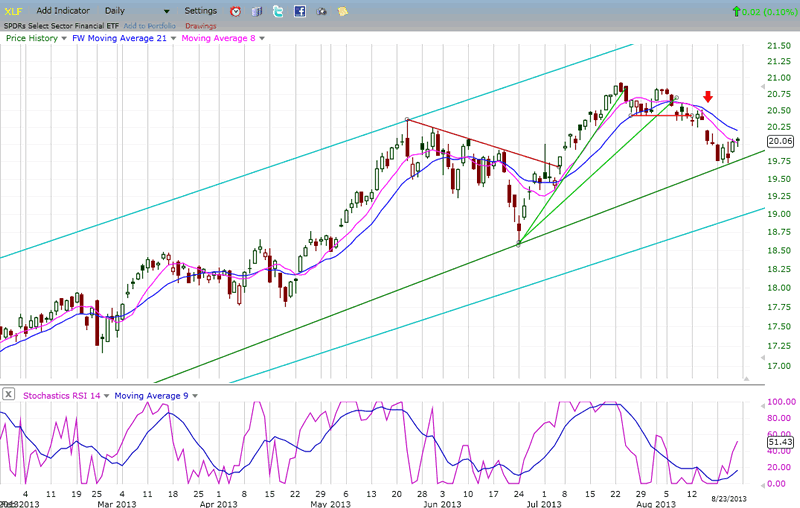
XLF (Financial SPDR)
XLF displayed relative weakness at the market high, thereby forecasting a top. Since then, it has not nullified that relative position to the SPX. On Wednesday, it found support on an important trend line but only had a weak bounce. Should it break below its trend line, it would most likely forecast the continuation of the market decline.
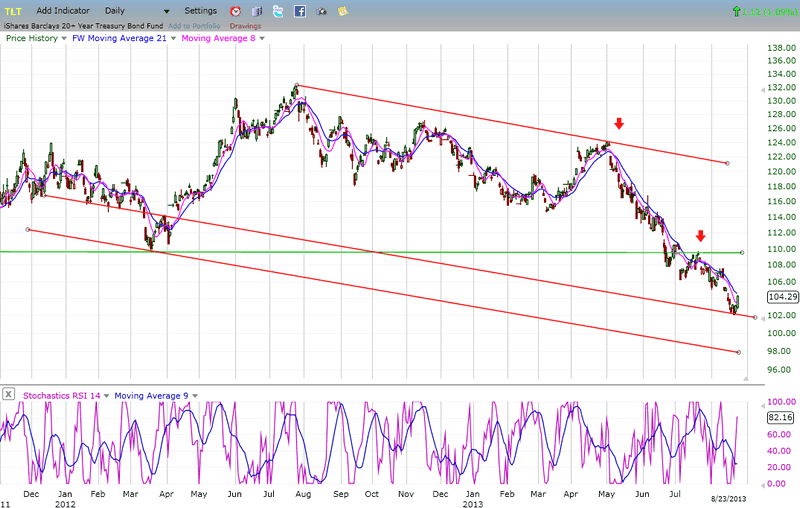
BONDS
TLT has continued to push lower in a relentless decline from its all-time high, breaking a succession of important support levels while establishing a long-term downtrend. It has now reached the lower confines of a broad channel where it may be able to stabilize and perhaps even start a rally, but if it does, it will be limited by the strong support line which was broken at the 110 level. No meaningful forecast for the short-term can be made at this time.
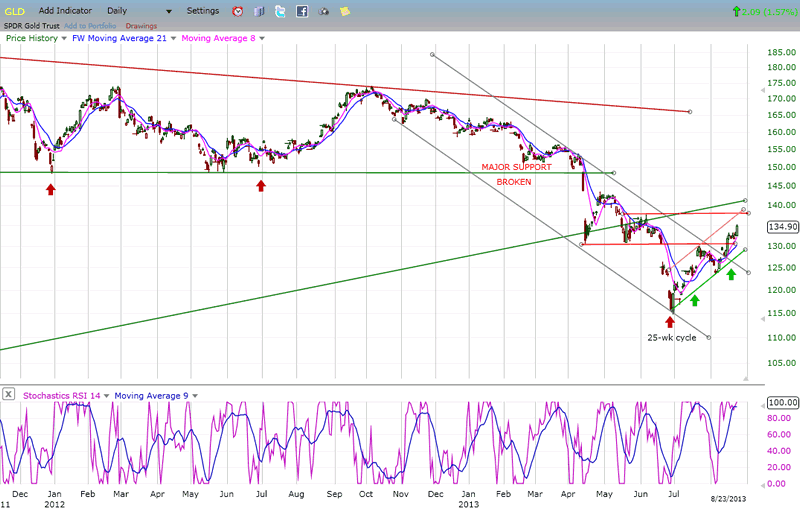
GLD (ETF for gold)
GLD continues its oversold rally which, at this time, can only be viewed as a corrective action in a long-term downtrend. After the damage done to the index over the past few months, it is unlikely that it would be capable of starting a significant move to the upside until it shows that it can overcome a broken, long-term uptrend line and a major support level which has now become resistance. At best, for now, this could be a back-test of the major trend line which was broken decisively in June.
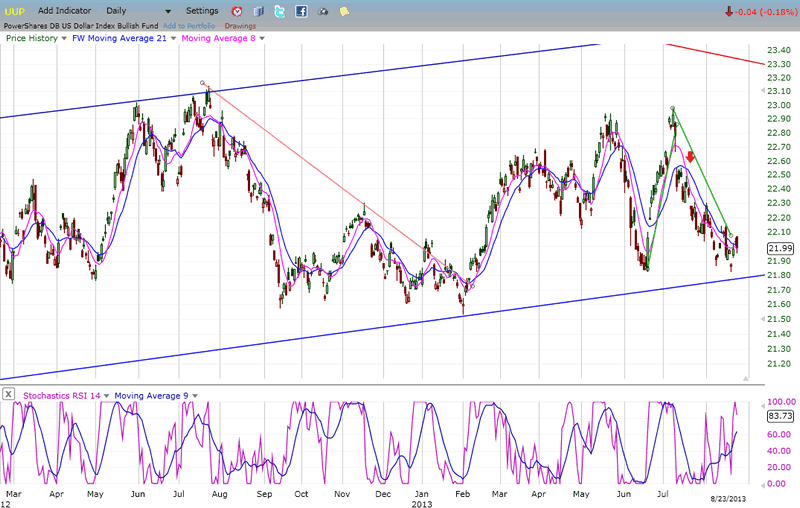
UUP (dollar ETF)
UUP is showing some signs of wanting to hold above its long-term channel line. Let's give it a little more time to make sure that this is what it is doing.
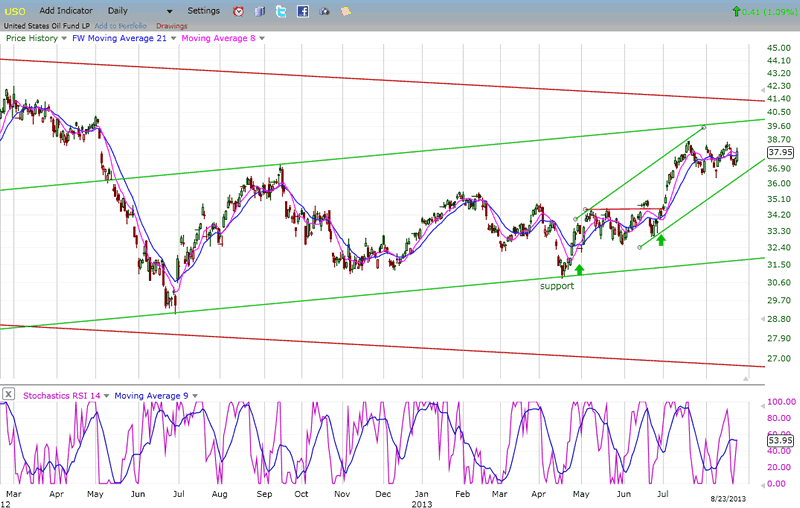
USO (United States Oil Fund)
USO has consolidated after emerging from the base it built between 33 and 34. The base carries a potential for higher prices, and I believe that this is only a consolidation which will eventually resolve itself in a continuation of the uptrend. How much longer the consolidation will last probably depends on how world events impact the price of oil in the near future. To some extent, the Egyptian turmoil may already have been more responsible for the recent rise in prices than increased demand generated by economic growth.
Summary
We have a disconnected market with a very weak Dow Industrials and much stronger NASDAQ. It is difficult to see how the market can resume its bull market trend until the Dow improves its performance. It is probably the key to the length and extent of the decline which, at this time, does not look complete.
The correction is likely to produce an A-B-C pattern, and next week should determine whether wave B has already started, or if this is just a two-day blip in the A phase of the correction. Overbought hourly indicators and negative divergence in the breadth oscillators appear to suggest that at least a near-term pull-back is due and perhaps an extension of the decline as well.
FREE TRIAL SUBSCRIPTON
If precision in market timing for all time framesis something that you find important, you should
Consider taking a trial subscription to my service. It is free, and you will have four weeks to evaluate its worth. It embodies many years of research with the eventual goal of understanding as perfectly as possible how the market functions. I believe that I have achieved this goal.
For a FREE 4-week trial, Send an email to: ajg@cybertrails.com
For further subscription options, payment plans, and for important general information, I encourage
you to visit my website at www.marketurningpoints.com. It contains summaries of my background, my
investment and trading strategies, and my unique method of intra-day communication with
subscribers. I have also started an archive of former newsletters so that you can not only evaluate past performance, but also be aware of the increasing accuracy of forecasts.
Disclaimer - The above comments about the financial markets are based purely on what I consider to be sound technical analysis principles uncompromised by fundamental considerations. They represent my own opinion and are not meant to be construed as trading or investment advice, but are offered as an analytical point of view which might be of interest to those who follow stock market cycles and technical analysis.
Andre Gratian Archive |
© 2005-2022 http://www.MarketOracle.co.uk - The Market Oracle is a FREE Daily Financial Markets Analysis & Forecasting online publication.