


US Dollar Major Bottom Forecast Within Next Two Weeks
Currencies / US Dollar Apr 05, 2008 - 07:57 PM GMTBy: Marty_Chenard

 This morning's update will look at two U.S. Dollar charts ... short term and long term.
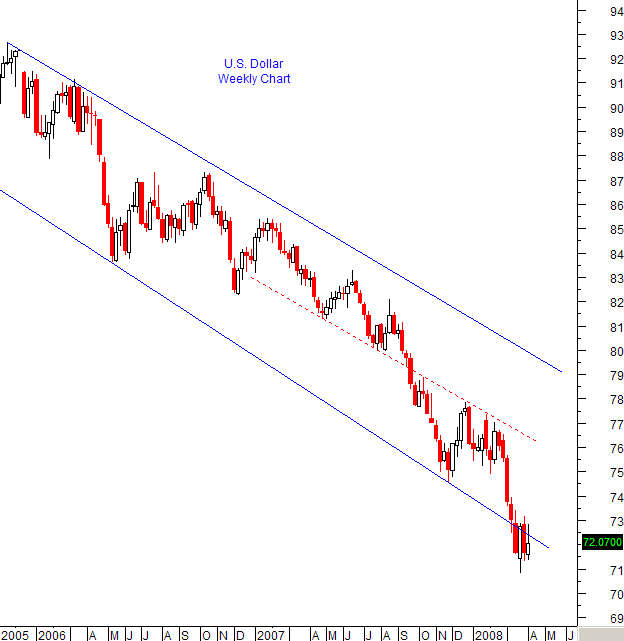
The first is the weekly chart of U.S. Dollar going back to 2005. Very clearly, you can see that it has been in a down trend since 2005. Its descending channel has held steadily all the way down.
However, the Dollar fell below the channel and held support for the past four weeks. It is now in a bottoming consolidation. See the next chart ...
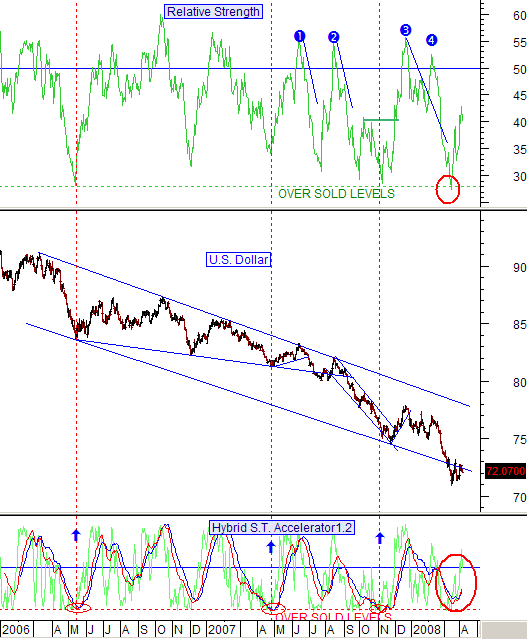
This next chart shows the daily movement of the Dollar from 2006 to today.
This chart has two indicators attached to it ... the Relative Strength reading, and our Hybrid Accelerator indicator.
Here is what these indicators are saying:
1. The Relative Strength shows that the Dollar reached an oversold level on March 17th. Once the Dollar hits an oversold level, the typical pattern is for it to consolidate for a few weeks and then start an upside move.
We are now in our 4th. week of consolidation.
2. Now, take a look at our Hybrid Accelerator at the bottom of the graph. Its red/blue trend lines are now moving up, confirming that an oversold bottom is gathering the muster to change to an upside move.
The fast green Hybrid Accelerator indicator is now positive (above the horizontal line). It has not made a higher top over the previous (green indicator) move yet. But when it does ... within the next two weeks, that will confirm the Dollar is ready to move to the upside. [This chart is posted on our Advanced subscriber site every day.]
By Marty Chenard
http://www.stocktim ing.com/
Please Note: We do not issue Buy or Sell timing recommendations on these Free daily update pages . I hope you understand, that in fairness, our Buy/Sell recommendations and advanced market Models are only available to our paid subscribers on a password required basis. Membership information
Marty Chenard is the Author and Teacher of two Seminar Courses on "Advanced Technical Analysis Investing", Mr. Chenard has been investing for over 30 years. In 2001 when the NASDAQ dropped 24.5%, his personal investment performance for the year was a gain of 57.428%. He is an Advanced Stock Market Technical Analyst that has developed his own proprietary analytical tools. As a result, he was out of the market two weeks before the 1987 Crash in the most recent Bear Market he faxed his Members in March 2000 telling them all to SELL. He is an advanced technical analyst and not an investment advisor, nor a securities broker.
Marty Chenard Archive |
© 2005-2022 http://www.MarketOracle.co.uk - The Market Oracle is a FREE Daily Financial Markets Analysis & Forecasting online publication.