


Stock Market Presidential Cycle Calls for Strong Bull Run into US Election
Stock-Markets / US Stock Markets Apr 07, 2008 - 12:37 PM GMTBy: Andre_Gratian

 Current Position of the Market
SPX: Long-term trend - Election years that fall in the 8th year of the Decennial pattern call for consolidation in the early part of the year followed by a strong finish. But the 6-yr cycle which is scheduled to bottom in late Summer/early Fall could also play a restraining role, followed by an eventual bull market top in 2009-2010.
SPX: Intermediate trend - an extended intermediate-term consolidation is in the process of ending and may already have ended.
Analysis of the short-term trend is done on a daily basis with the help of hourly charts. It is an important adjunct to the analysis of daily and weekly charts which determines the course of longer market trends.
Daily market analysis of the short term trend is reserved for subscribers. If you would like to sign up for a FREE 4-week trial period of daily comments, please let me know at ajg@cybertrails.com .
Overview:
The market is still basically on track to follow the Decennial 8th year and presidential election pattern which calls for weakness early in the year followed by a resumption of the uptrend.
The recent intermediate correction in the SPX retraced approximately .382 of the bull market uptrend since October 2002. Since a normal correction is deemed to be 50% of the previous move, we have to admit that, so far at least, we are still in a strong bull market and that it is not conforming to all the dire forecasts about the economy. Since the January 2008 low, the index has moved in a range of about 140 points, thereby creating either a base from which to resume the uptrend, or a consolidation before continuing the downtrend.
Another possibility (which I favor) is that after completing this base, the SPX will start another uptrend of limited duration which will fall short of the former highs, and then expand its consolidation into the Fall. After that, it would then be in a position to rise to new highs into 2009-2010 to put an end to the bull market.
Three weeks ago, intra-day, the SPX went slightly lower than in January and started a rally which lasted until last week. However, it seems to be running out of steam before overcoming its February highs and destined to pull back into its base one more time before another attempt at breaking out. Most indices are following the same pattern with one notable exception which will be discussed later.
What's ahead?
Chart pattern and momentum:
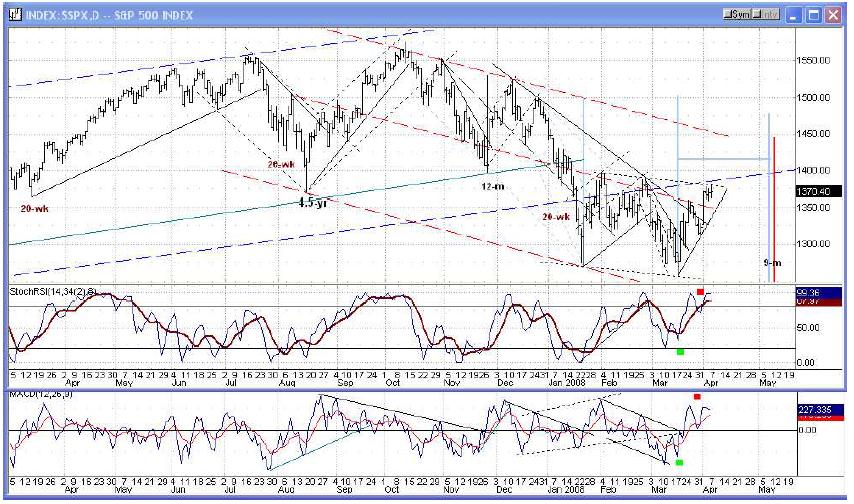
It's amazing how a few well-placed lines on a graph can define the trend of the market. Look at the following chart of the daily SPX. The red-dashed lines represent the confines of the intermediate correction. Note how prices traded in the top part of the channel until January, then dropped through the mid-point at that time. Since then, trading has confined itself to the lower part of the intermediate channel and is forming a basing pattern. Last week, the index attempted a break-out of that base, but failed. It has now traded sideways for 3 days and is much more likely to retrace into its base than to follow though on the upside. Why? Look at the indicators. I have placed a little red square over both. This means that, besides being overbought, they are losing momentum, beginning to show divergence, and are making the type of pattern that normally precedes a short-term top.
Add to this the facts that the index has met a projection, is faced with overhead resistance and that an important cycle is due to bottom in about a month. These factors combined make a compelling case for another pull-back just ahead.
Cycles
There could have been some longer term cycles causing the January low which prevented further deterioration. Since then, we have been concerned with the effects of the 5-yr cycle and the Martin Armstrong business cycle date of March 22. Perhaps these conspired with the 10-wk cycle to bring us the mid-March correction, and they are now behind us.
What does lie directly ahead, is the 9-mo Hurst cycle which is due to make its low in the first two weeks of May. We may be beginning to witness its influence on prices and this is why the rally from mid-March is losing momentum.
There are also some short-term cycles which will be influencing the market during the next 2 weeks, one of them due to make its low in the middle of the coming week.
Cycle analysts are also focused on the fact that 4/11 will be 180 degrees (calendar days) from the October top. This time span is normally associated with a CIT (change of trend).
The current cycle configuration seems to suggest that we have a choppy week ahead, followed by a decline into early May.
Projections:
One of the reasons given above for the current rally to be over was that it had basically met its projection which was about 1385. On Friday, the SPX touched 1380.91, which may be close enough, although we do not yet have a confirmed short-term top.
The most likely projection given earlier for the intermediate trend was for the SPX to bottom above 1235. So far, so good! The current pull-back into the low of the 9-mo cycle should stay well above that level, but it is not possible to estimate the extent of the decline until the shortterm top is completely formed, which may not be until the end of next week.
If the current low of the correction remains in place at 1256.98 and the SPX does break out of its base for another intermediate uptrend, we can estimate that it should rise to about 1475 before there is a need for further consolidation.
Breadth
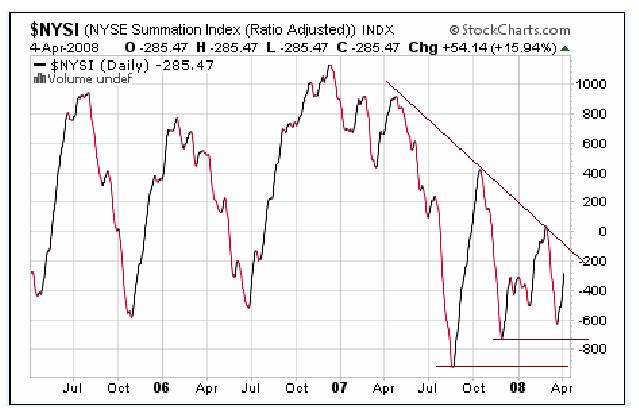
The long-term breadth picture, as represented by the Summation Index, has not changed much over the past few weeks. As you can see above (courtesy of StockCharts) It is still in a consolidation stage similar to that of the price pattern, and it is still in negative territory. For a viable uptrend to develop in the market, it will have to be supported by a similar uptrend in this index.
Near-term, the A/D index is overbought and losing upside momentum with a slight negative divergence. This suggests that a short-term correction is about to take place.
Market Leaders and Sentiment
The sentiment indicators are now closer to neutral than they were in the past few weeks and the Insider Trading Ratio index remains bullish.
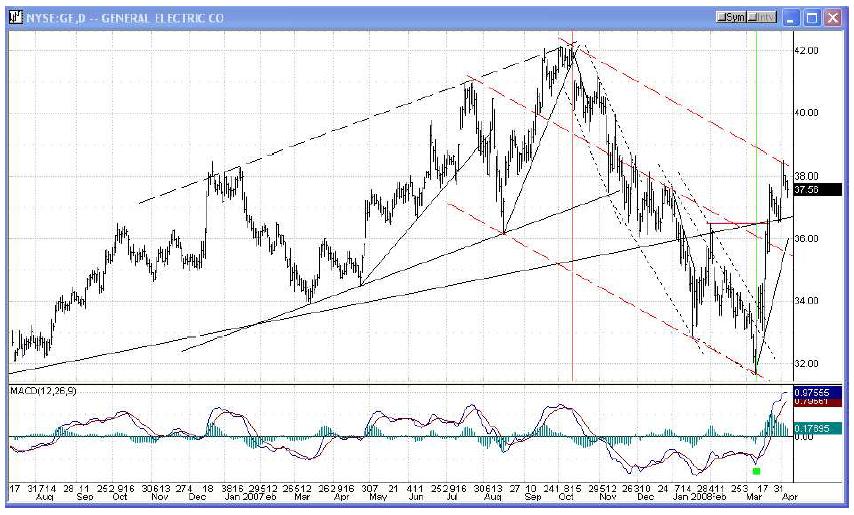
The star of market leaders remains GE, which, as you can see, has quickly moved to the top of its intermediate channel ahead of the indices.
The NDX has improved lately, and is now moving ahead of the SPX in its recovery. Last week it broke out above the February highs and has been the only index to do this so far.
The Financial index, is in a basing pattern similar to the other indices, but is noticeably weaker.
Summary
The short-term rally which started at the 1257 bottom has reached its projection and is losing momentum. This and other factors suggest that the SPX could soon retrace into its base one more time into early May in conjunction with the 9-mo cycle low.
This could be the last test of the lows before a reversal of the intermediate uptrend.
The following are examples of unsolicited subscriber comments:
What is most impressive about your service is that you provide constant communication with your subscribers. I would highly recommend your service to traders. D.A.
Andre, You did it again! Like reading the book before watching the movie! B.F.
I would like to thank you so much for all your updates / newsletters. as i am mostly a short-term trader, your work has been so helpful to me as i know exactly when to get in and out of positions. i am so glad i decided to subscribe to turning points. that was one of the best things i did ! please rest assured i shall continue being with turning points for a long while to come. thanks once again ! D.P.
But don't take their word for it! Find out for yourself with a FREE 4-week trial. Send an email to ajg@cybertrails.com .
By Andre Gratian
MarketTurningPoints.com
A market advisory service should be evaluated on the basis of its forecasting accuracy and cost. At $25.00 per month, this service is probably the best all-around value. Two areas of analysis that are unmatched anywhere else -- cycles (from 2.5-wk to 18-years and longer) and accurate, coordinated Point & Figure and Fibonacci projections -- are combined with other methodologies to bring you weekly reports and frequent daily updates.
“By the Law of Periodical Repetition, everything which has happened once must happen again, and again, and again -- and not capriciously, but at regular periods, and each thing in its own period, not another’s, and each obeying its own law … The same Nature which delights in periodical repetition in the sky is the Nature which orders the affairs of the earth. Let us not underrate the value of that hint.” -- Mark Twain
You may also want to visit the Market Turning Points website to familiarize yourself with my philosophy and strategy.www.marketurningpoints.com
Disclaimer - The above comments about the financial markets are based purely on what I consider to be sound technical analysis principles uncompromised by fundamental considerations. They represent my own opinion and are not meant to be construed as trading or investment advice, but are offered as an analytical point of view which might be of interest to those who follow stock market cycles and technical analysis.
Andre Gratian Archive |
© 2005-2022 http://www.MarketOracle.co.uk - The Market Oracle is a FREE Daily Financial Markets Analysis & Forecasting online publication.