Crude Oil Price Volatility on the Way?
Commodities / Crude Oil Oct 10, 2013 - 04:57 PM GMTBy: Submissions
 Tom Therramus writes: In a previous Oil-Price.net articles published in 2010 and 2011 , I discussed predictive relationships that appear to occur between large, rapid swings in oil price and recessions, stock market crashes and shifts in political polls. Given the economic disruptions that nearly always happen in the aftermath of oil shocks, it seems important to understand what is behind the timing of transient instabilities in the oil markets.
 Last time I examined whether repetitive patterns could be found in the ebb and flow of oil price changeability (volatility) between 2000 and 2010. To do this, rolling standard deviations were calculated through a 120-month series of monthly oil prices starting from January 2000. A mathematical tool called Fast Fourier Transform (FFT) was then used to scan for repeating patterns in this rolling 10-year sequence.
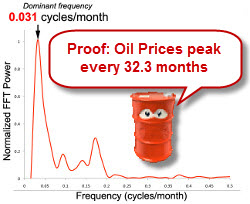
What I found was that from the mid 2000s, changes in oil price showed evidence of a multi-year oscillation. This pattern was marked by a single dominant frequency that peaked at 2.8 years (~32 months). Putting this in an alternate way, during the first decade of the new millennium, volatility in the price of oil appeared to spike every two to three years.
In a confirmation of the potential emergence of a long-term rhythmic pattern, oil price variance spiked again in April 2011, precisely 32 months after the last major round of volatility had topped out in July 2008.
It is coming up on 30 months since the now largely forgotten market turbulence of mid-2011. If oil price volatility is oscillating in a repeating two to three year cycle, then can we expect to see another wave of instability in oil prices occur in late in 2013 or early 2014
Oil price has begun showing signs of an uptick in twitchiness recently - albeit that the increase in volatility is as yet modest. As I write this piece in October 2013, a crisis triggered by the use of chemical weapons in Syria, is the cause du-jour that is being tagged for oil ramping-up from the mid-90s to up over 110 dollars a barrel - an explanation that I find doubtful, but this is by-the-by.
It remains to be seen whether the oscillatory signal described in my 2011 Oil-Price.net article continues into the future. However, I have used oil price data that has accumulated since my earlier publication to extend the analysis - the results of which will now be shared with readers.
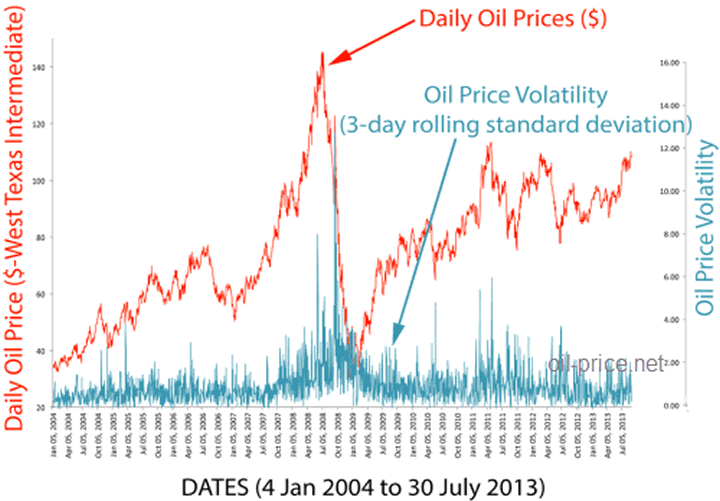
To improve resolution of changes in oil price volatility over the last 10 or so years, I used a slightly different approach. Instead of scanning through MONTHLY averages, a rolling 3-day standard deviation was calculated through DAILY prices of West Texas Intermediate (WTI) crude oil from 5 January 2004 to 30 July 2013.
The time series for the daily price of WTI oil (red line) and its corresponding rolling 3-day standard deviation (blue line) for the period are shown in Figure 1. For those who follow oil prices, the red line on the plot is all too familiar - distinguished as it is by the scary, vertiginous peak of 2008.
Figure 1 - Oil Price Volatility

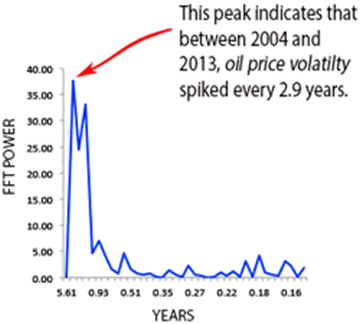
To scan for evidence of repeating signatures in the serrate blue line that traces oil price volatility on the figure, I again used fast Fourier transform. The results of this analysis is summarized in Figure 2 - and from this plot it can be seen that during the last 8 years price volatility has exhibited a dominant periodicity of ~2.9 years (33 months).
Figure 2 - Oil Price Spectral Diagram

This 2.9-year estimate for the period between spikes, based on daily oil prices, is in agreement with my 2011 , estimate - calculated as it was monthly prices. Thus, the updated analysis accords with the previous finding - namely, that between 2004 and 2013 variance in the price of oil demonstrated a tendency to spike at a frequency of every two to three years.
Readers of my previous articles will know that I suspect that the "rinse and repeat" volatility cycle suggested by my analyses results from a global plateau in oil production being reached in 2005. I favor the hypothesis that an autonomous (e.g., like a heart beat) oscillation in price volatility has emerged as a result of imbalances between supply and demand at this production plateau. Interestingly, similar oscillatory phenomena have been noted as an emergent property of predator-prey relationships in nature.
A major new development in the hunt for oil is the rise of "Fracking" - an extraction technology that has pushed the US to the forefront as a major producer. It will be interesting to watch and see whether "Fracking" alters the dynamics of oil price changeability in the next few years.
If a new spike in price variance does occur in coming months, then it would pay to keep an eye on stocks, given the tendency of the market to react to oil shocks. Also, if a new wave of instability in the oil market sweeps in, then the 2014 congressional elections could have surprises in store. Stay tuned to this frequency.
By Tom Therramus
This article was written by Oil-Price.net which provides free information on crude oil.
© 2013 Copyright Oil-price.net- All Rights Reserved Disclaimer: The above is a matter of opinion provided for general information purposes only and is not intended as investment advice. Information and analysis above are derived from sources and utilising methods believed to be reliable, but we cannot accept responsibility for any losses you may incur as a result of this analysis. Individuals should consult with their personal financial advisors.
© 2005-2022 http://www.MarketOracle.co.uk - The Market Oracle is a FREE Daily Financial Markets Analysis & Forecasting online publication.


