


U.S. Dollar Diamond Top Pattern Implications for Gold and Silver and Mining Stocks
Commodities / Metals & Mining Oct 21, 2013 - 10:30 AM GMT

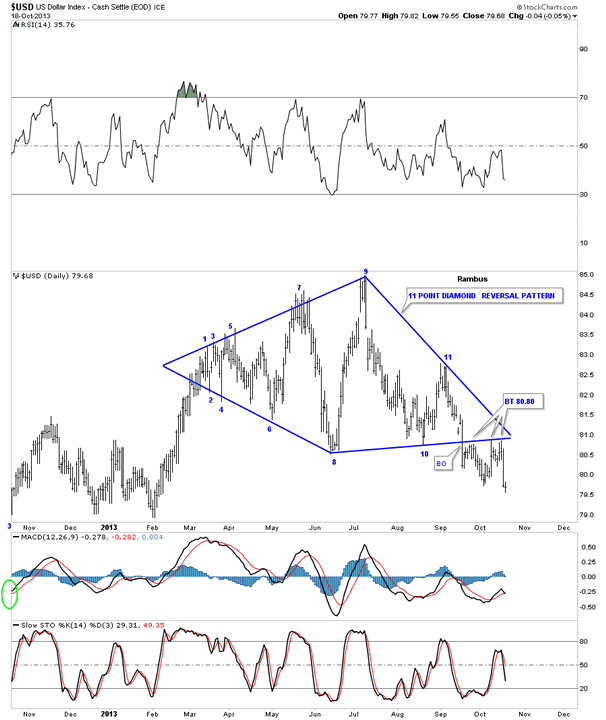
 In this Weekend Report I would like to show you some charts as to why I have made an abrupt short term move out of our short positions in the precious metals complex. I know some of you think I have lost my mind but I can assure you that isn't the case. Regardless if I'm bullish or bearish I'm always looking at both sides of the market looking for clues for either direction. This week we got a major clue when the US dollar finally finished its third backtest to the bottom rail of the 11 point diamond top. It's possible that gold and US dollar can trade in the same direction for awhile but I don't think that will be the case longer term. So lets look at some charts for the US dollar first as that's where the biggest clues lie.
A diamond is generally consider a bearish topping pattern but from my experience they can go either way. I've shown you some beautiful diamond consolidation patterns that worked out very well. It's the same with the rising and falling wedges. Whichever way they breakout will be the direction of the next move. It just so happens that our 11 point diamond pattern on the US dollar has broken down and out of the pattern. If the reversal point at #10 held and the price action rallied back up and through the top rail it would have been a consolidation pattern but that is not the case. After a month or so of backtesting the bottom rail of the diamond pattern it now looks like the move down on Thursday maybe starting the impulse leg lower.
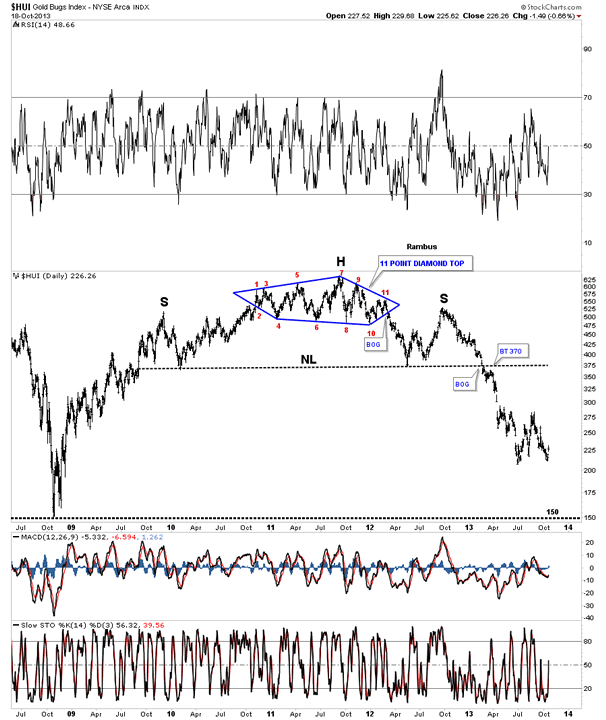
The reason the 11 point diamond on the US dollar chart is so negative for me is because one formed on the HUI as the head portion of the massive H&S top. When you spot one it pays to heed its warning either as a topping pattern or a consolidation pattern.
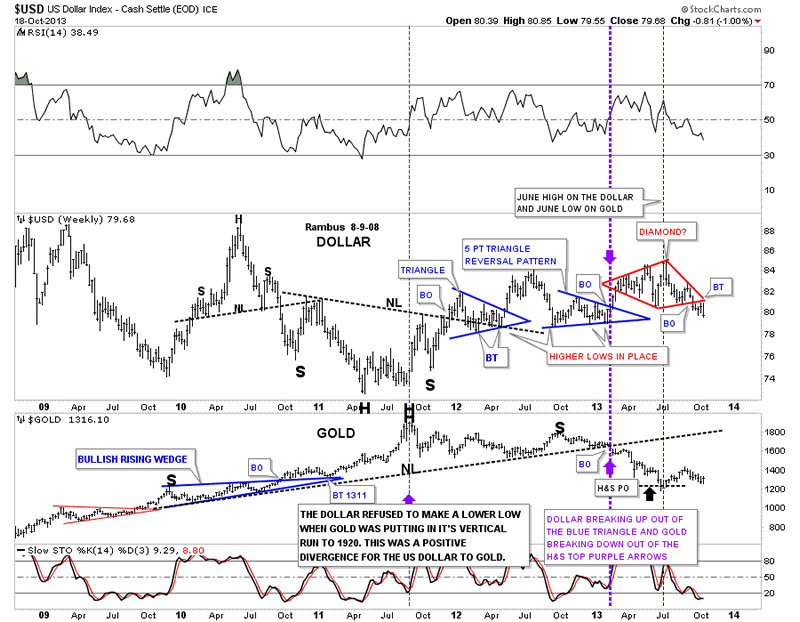
Below is a combo chart that has the US dollar on top and gold on the bottom. Up until the dollar broke below the diamond top five weeks ago I was bullish on the dollar and bearish on gold which proved to be the case since gold topped out in 2011. I don't know about you but when I look at the red diamond and see nothing but air below it it doesn't make me feel very bullish. Sir Chuck here is a strongly slanted H&S top on gold, that you won't see anywhere else but at Rambus Chartology, that reached its price objective at the June low as the US dollar was putting its high on the diamond. As you can see over the last two months or so the inverse correlation hasn't been that strong but I think if the dollar continues to fall we will see gold move higher.
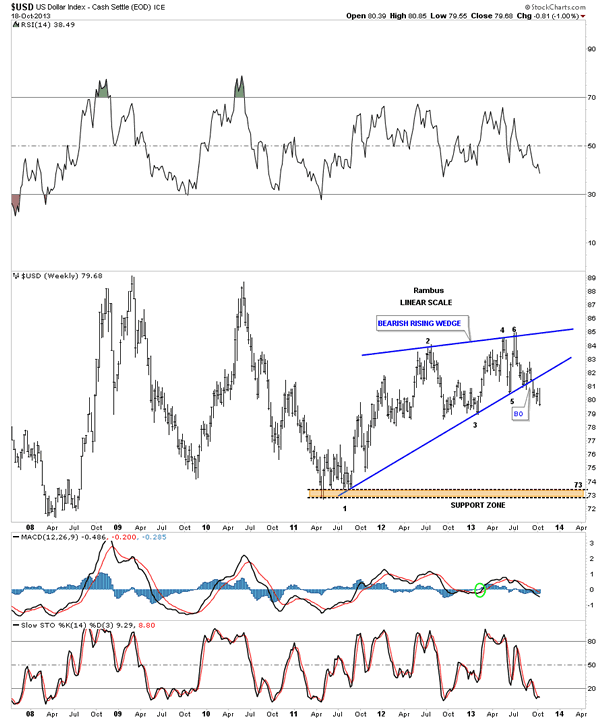
Lets look at one more chart for the US dollar that shows a 6 point bearish rising wedge. The bottom of the bearish rising wedge would be the price objective which would come in around the 73 area. How long it takes the dollar to reach that first real support zone should tell us how long gold will have to be in rally mode.
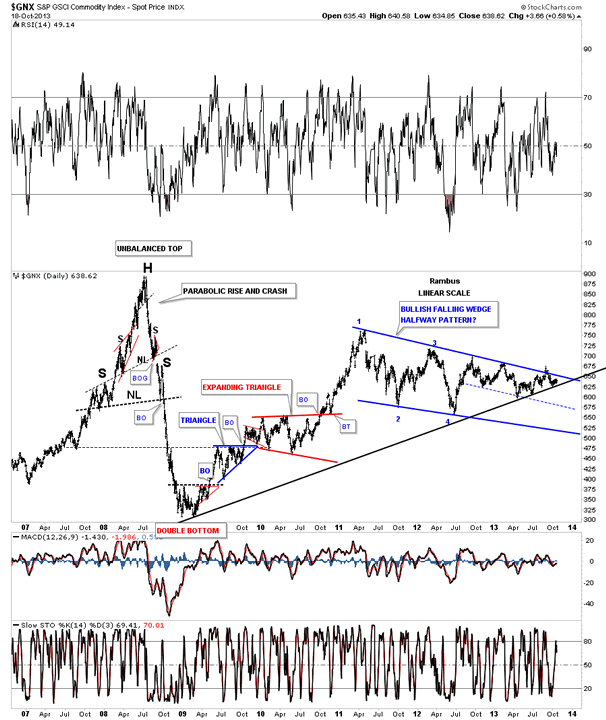
A weak US dollar usually means a stronger commodities market in general. The chart below shows the GNX trading in a falling wedge pattern for just under three years now. As you can see the price action is now being squeezed into the apex of the bottom black uptrend rail and the top rail of the blue falling wedge. If the GNX breaks out through the top blue rail I would have to consider this big falling wedge as a halfway pattern to the upside. As you can see this commodities index can really move in both directions. It would also be telling us that commodities in general maybe a good place to park some capital.
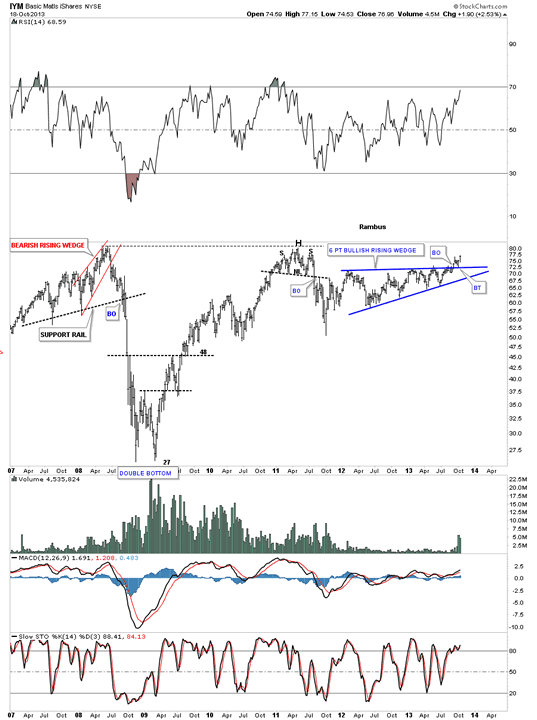
There is an area I like to follow when we see a weaker US dollar and that is the Basic Materials sector. As you can see the IYM, basic materials etf, has just broken out of a 6 point bullish rising wedge and completed the backtest a week ago. It's hard to believe but this etf is within striking distance of its all time highs.
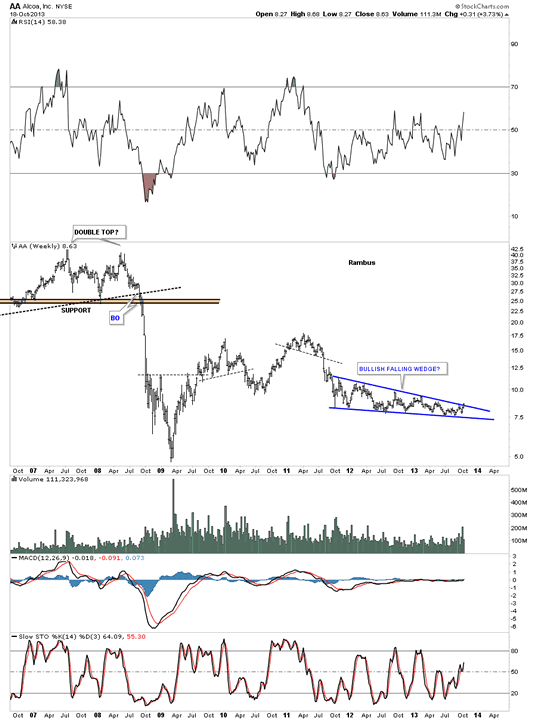
Lets looks at several stocks that are in the basic materials sector. AA has been building out a very tight falling wedge that is right on the verge of breaking out through the top rail. It had many chances to break below the bottom rail over the last two years but it never happened.
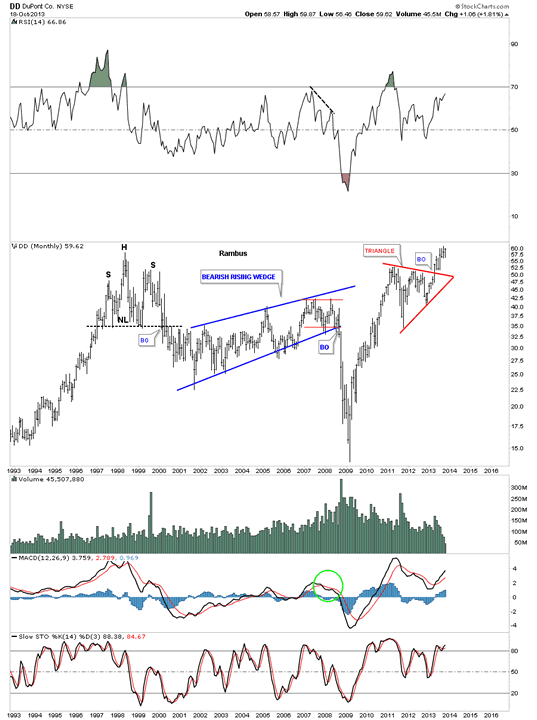
DD - DuPONT has broken out of a very pretty symmetrical triangle consolidation pattern and is now in an impulse move higher. It's also trading at new all time highs.
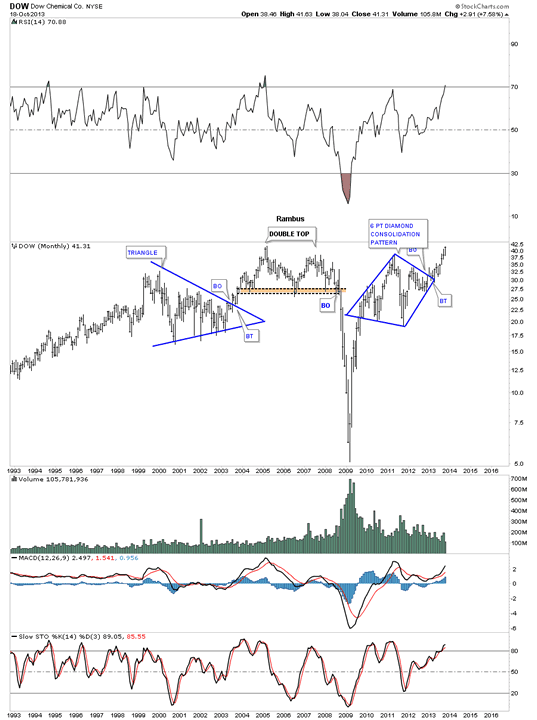
Dow Chemical has broken out of a diamond consolidation pattern and is running to the upside trading very close to new all time highs.
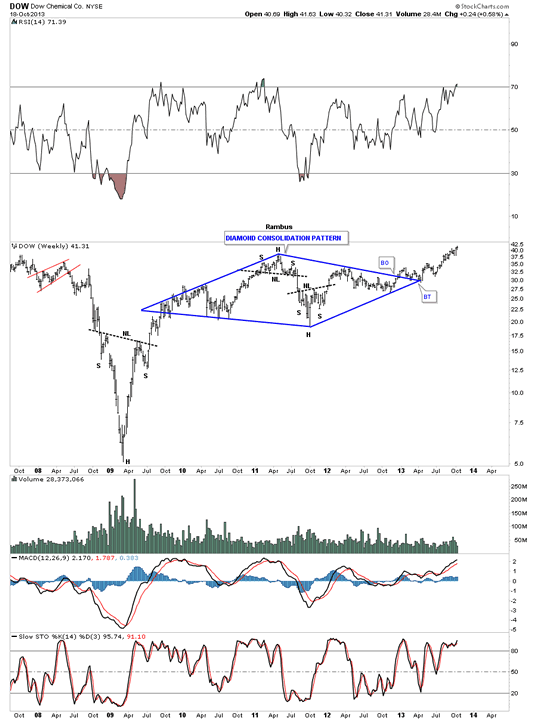
Dow Chemical weekly diamond.
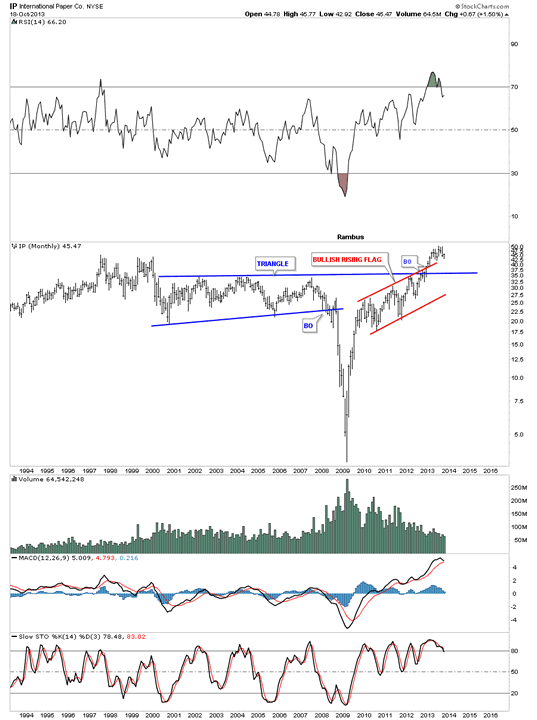
IP - International Paper is trading back above the top rail of the blue triangle that led to the 2008 crash low. It formed the red bullish rising flag just below the top blue rail and is now trading close to new all time highs.
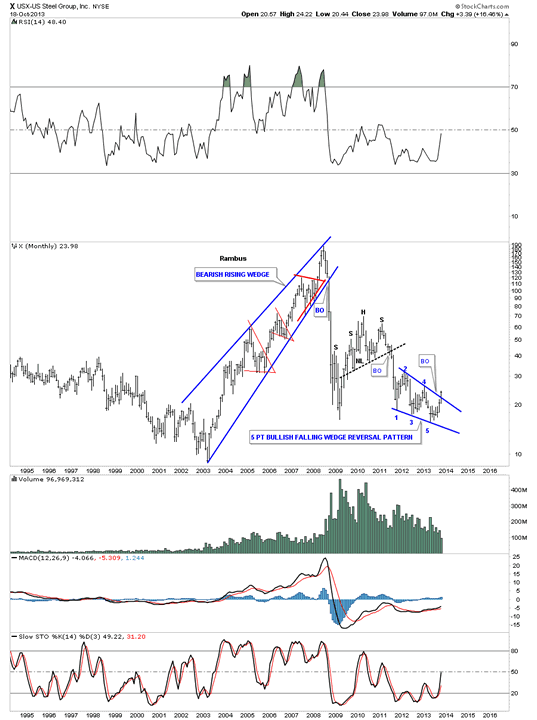
Lets look at one more stock in the basic materials sector that is just now breaking out of a 5 point bullish falling wedge. X - US Steel is trading way below its all time highs but it looks like a bullish setup to me as it has broken out of a 5 point bullish falling wedge. There is a lot of room to the upside on this one.
Next I would like to look at several of the very largest miners that have been morphing from what was looking like a H&S top pattern that is failing as the price action is now eroding the neckline to the upside. These H&S patterns were formed about the same time the HUI's big H&S top formed but unlike the HUI that crashed down to the 200 area these big miners kept hanging around their necklines. I kept wait for them to follow the HUI lower but they refused. Now with the weaker US dollar they're beginning to show some life.
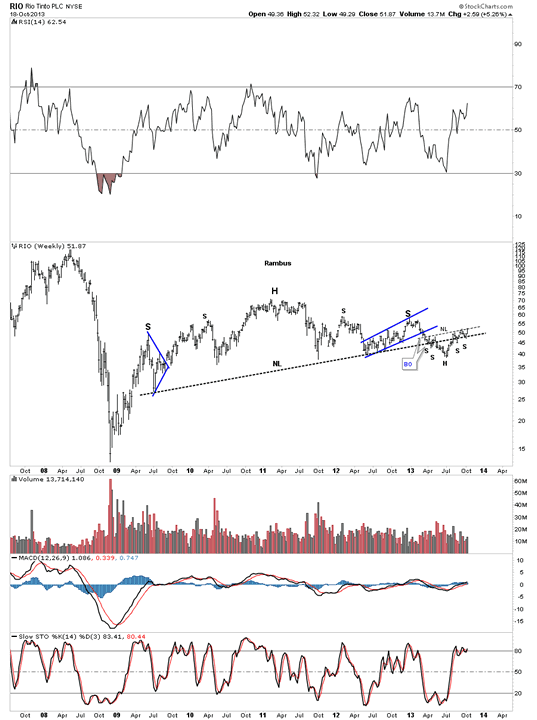
The first big miner I would like to show you is RIO that actually had a double H&S top with a clean breakout to the downside and backtest. Over the last eight weeks or so the price action has been trading just above the neckline and now looks like it maybe forming a smaller inverse H&S bottom right on the big neckline. It's still possible it could trade back below the neckline but I have to give the benefit of a doubt to the smaller inverse H&S bottom until prove otherwise.
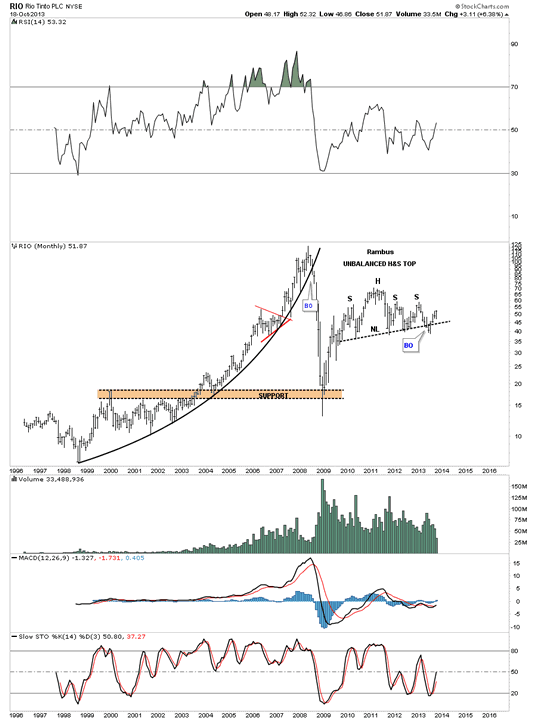
Below is the monthly chart for RIO that showed the unbalanced H&S top which now looks like a false breakout.
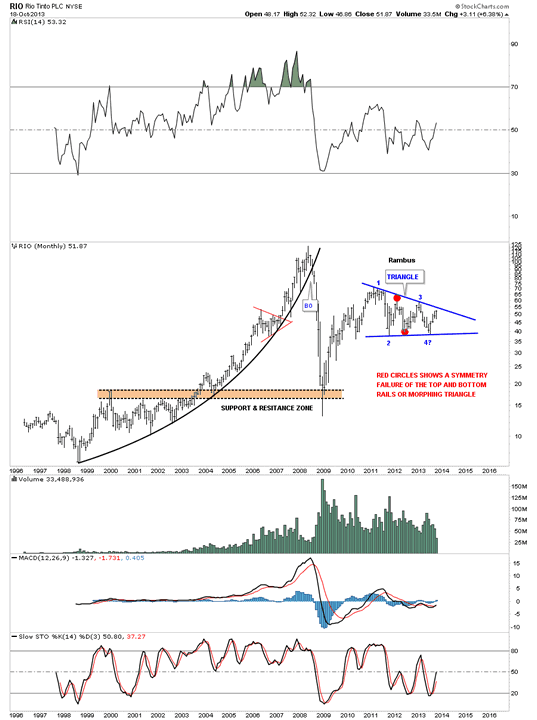
Below is the same monthly chart for RIO but this time I've changed the trendlines to the new pattern that is emerging. It still hasn't broken out of the top rail yet but if it does I would have to consider this triangle to be a halfway pattern. Note how the brown shaded support and resistance area held support during the 2008 crash.
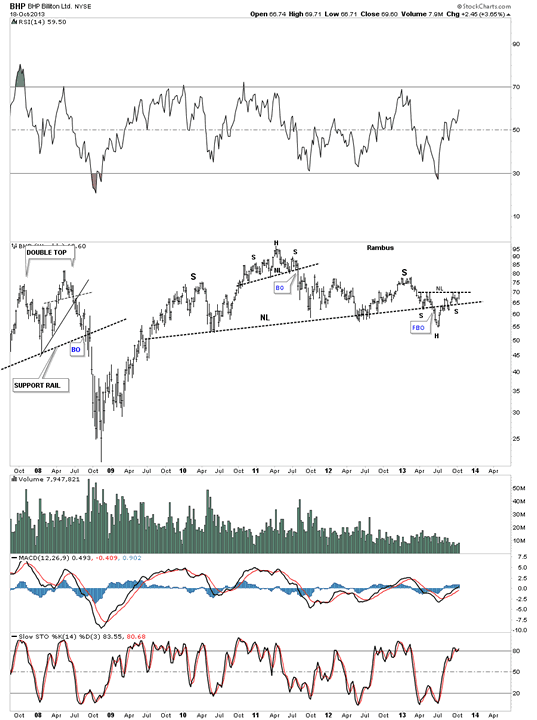
BHP weekly chart shows the exact same setup to RIO with the false breakout from the neckline and now is trading on top of the neckline.
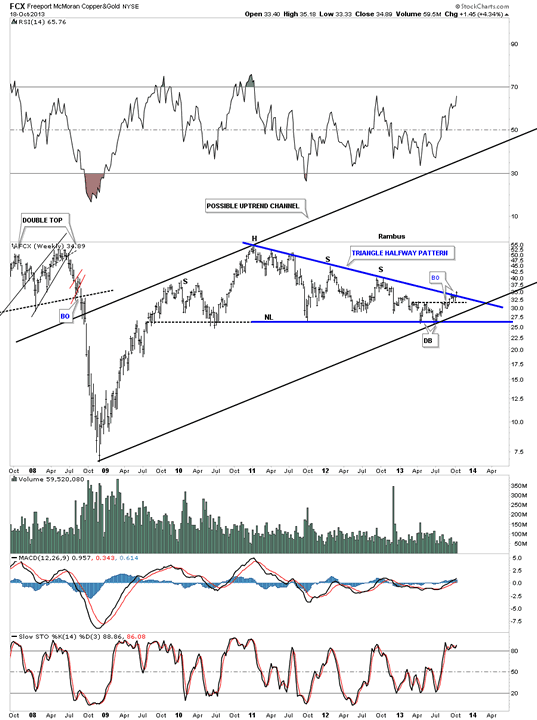
Lets look at one more big miner FCX that is actually breaking through the top rail of its now morphing H&S - triangle pattern. I've left the original annotation on this weekly chart that shows how the H&S looked in conjunction with the blue triangle. Note the small double bottom that formed on the right side of the chart that has led to the breakout of the top blue rail.
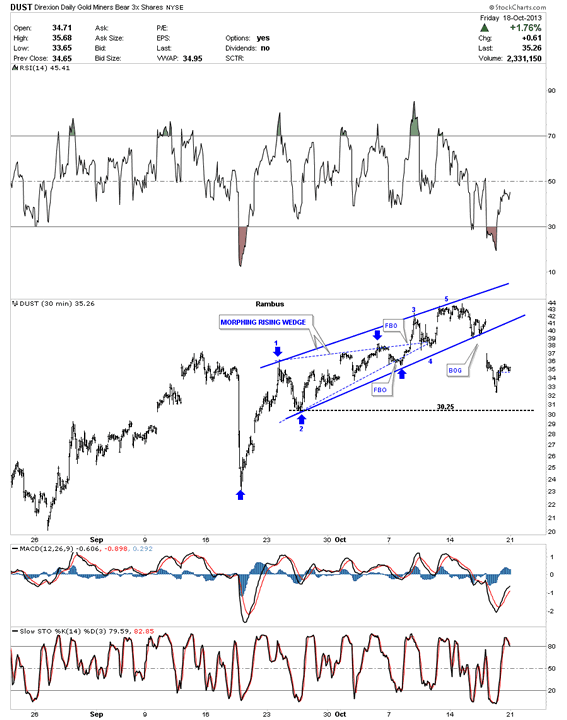
Lets look at one more stock that I know most of you are interested in. Earlier last week we were looking at a morphing rising wedge that looked like it was breaking out to the topside on the 30 minute chart. Right after the breakout it declined and found support at the apex of the original rising wedge, blue dashed trendlines. From there it made one last attempt to breakout and move higher but as you can see it lost momentum and close at the bottom rail. Nothing was broken at that time and it looked like it had just formed a small double bottom on the bottom rail. The next morning there was a big to the downside that forced us to exit our positions. What is left behind looks like a 5 point bearish rising wedge. When there is a big break like that it doesn't pay to be cute and out guess what the stock may do. That big gap is talking to us even if DUST recovers, discipline says to get out of harms way and don't ask questions.
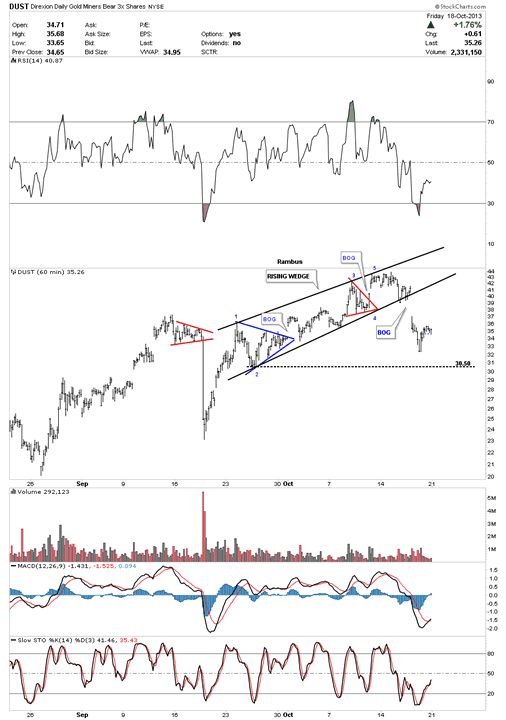
DUST 60 minute look.
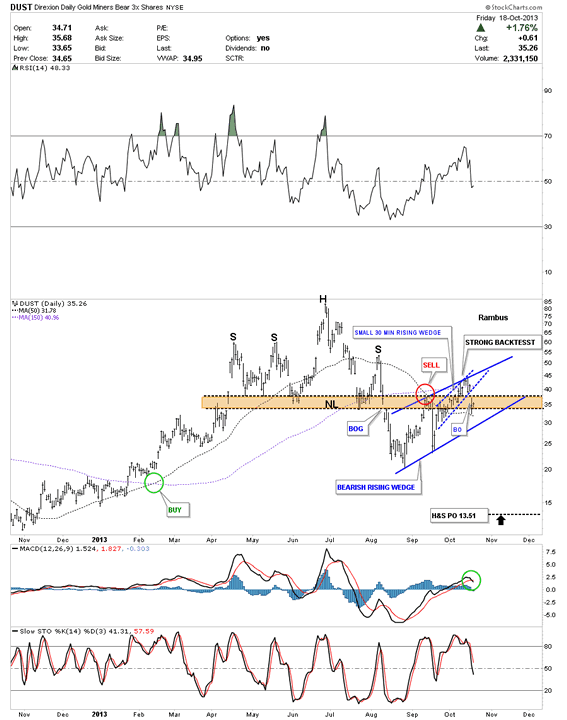
Below is a daily chart for DUST that shows what I think is happening right now. There is a possible unbalanced H&S top with a fat neckline, brown shaded area. There is a bigger rising wedge that is making a strong backtest to the neckline. I have to admit it's not the prettiest H&S top I've ever seen but it could fit the bill. Just like the HUI, that doesn't have a clear picture yet, is leaving some room for further interpretation. Right now DUST is trading between the 50 dma and the 150 dma. As you know we took a small starter position in NUGT based on the breakout from the smaller, rising wedge, blue dashed rails. The bigger rising wedge still hasn't broken out to the downside yet. if it does we can add more to our NUGT position. If DUST can rally back above the bottom dashed blue rail of the smaller rising wedge we would then have to exit our NUGT position.
If one can get the direction of the US dollar that goes along way toward making the right decision in which area to invest. Up until just recently the US dollar was in that chopping sideways diamond that didn't show itself as a top or consolidation pattern. With the breakout and now three backtests to the bottom rail of the blue diamond, the evidence now becomes undeniable until something changes for the positive for the dollar. The first thing the dollar would have to do to show it's becoming positive would be for it to trade above the apex of the blue diamond. That would get my attention. The burden of proof now lies with the dollar bulls to turn things around. I really believe that we are at the very beginnings of a major shift back into commodities again as the charts above are showing. It's still very early in the transition phase but the commodities have basically been consolidating for close to three years now. With a long term consolidation pattern you get a long term move in the same direction leading into the consolidation pattern. The US dollar is key going forward and if it stays in its downtrend commodities should benefit. It's still very early yet so we have plenty of time to put together our portfolios.
All the best
Gary (for Rambus Chartology)
FREE TRIAL - http://rambus1.com/?page_id=10
© 2013 Copyright Rambus- All Rights Reserved
Disclaimer: The above is a matter of opinion provided for general information purposes only and is not intended as investment advice. Information and analysis above are derived from sources and utilising methods believed to be reliable, but we cannot accept responsibility for any losses you may incur as a result of this analysis. Individuals should consult with their personal financial advisors.
© 2005-2022 http://www.MarketOracle.co.uk - The Market Oracle is a FREE Daily Financial Markets Analysis & Forecasting online publication.