


Inflation Stealth Taxes Consume Stock Market Gains and Retirement Plans
Stock-Markets / Financial Markets 2013 Oct 31, 2013 - 10:02 AM GMTBy: Dan_Amerman

 What if bottom line investment results for a nation as a whole were very different than the great majority of investors understood? What if most long term investment plans were based on what could be quite easily shown to be "bad information"?
These questions may seem a little difficult to accept, because clearly, with the continuous stream of news, commentary and analysis about investment markets that are available 24/7 in newspapers, magazines, blogs and cable business news – such a discrepancy couldn't exist.
Or could it?
In this researched-based tutorial, we're going to take the conventional wisdom about stock market performance and apply two very simple – and irrefutable – truth tests to what real historical results have been. These "truth" tests consist of adjusting for inflation, and adjusting for taxes.
The premise behind these two simple truth tests is that what matters when it comes to investment performance over the long term is what your investments will buy for you after you've paid your taxes. Which means that adjusting for inflation and taxes is not optional – but mandatory.
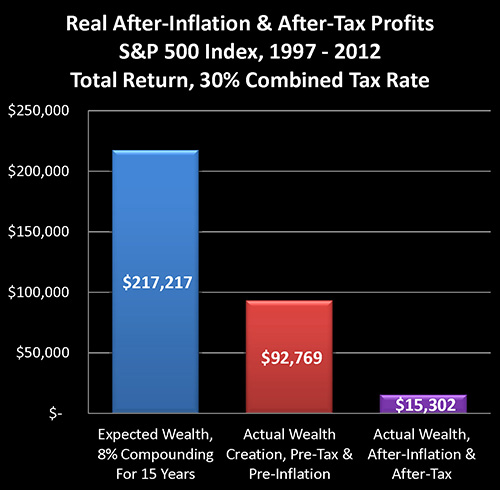
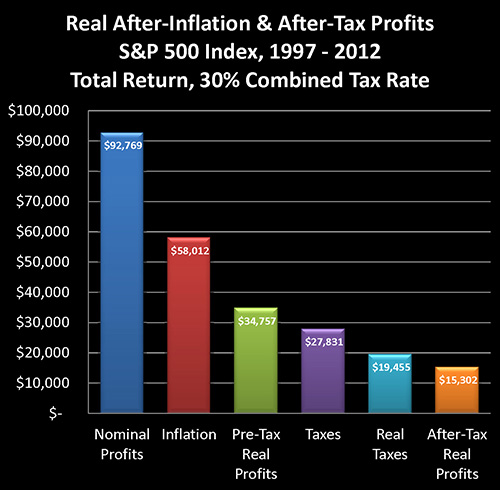
As is illustrated in the graph above, once we take these two simple steps, and apply them to 15 years of real-world performance of the Standard & Poor's 500 Stock Index on a total return basis, we will find that for stock investors across the United States – there has been a 93% failure to perform. In other words, if we take common market assumptions from the late 1990s and we compare actual performance, 93% of expected investment results for the nation as a whole disappear like vapor.
Which then leads to the next logical question. If some investors clearly understand the issues, whereas most investors do not – does that open up opportunities for this minority of investors?
Adjusting Price Returns For Inflation And Taxes
This analysis is Part Two of the Stealth Stock Taxes Consume Market Gains & Retirement Plans series. It can be read on its own, or it can just as easily be read as the beginning of the series as it can the end of the series.
What we will do is fully integrate two essential factors – inflation and taxes – which MUST be taken into account if we are to get to the true investment bottom line of the purchasing power of our investments after the payment of taxes.
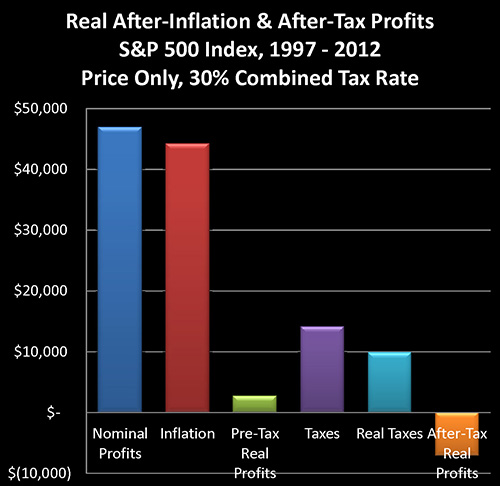
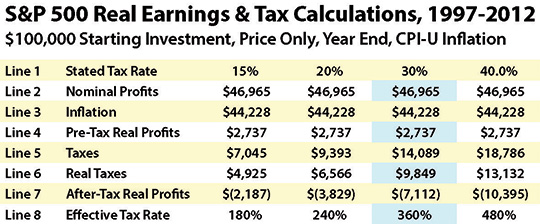
In Part One of this series, we took a look at price returns only on the S&P 500 from the end of 1997 through the end of 2012, and based on an assumed starting portfolio of $100,000, developed the graph and chart below.
http://danielamerman.com/articles/2013/StealthC.html
As shown, what appeared to be an almost 50% increase in the value of stock portfolios for investors across the country, turned out to be a mere 2.7% increase once we adjust for the change in purchasing power of the US dollar.
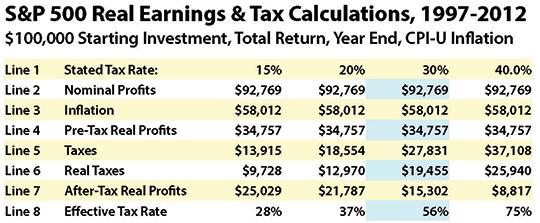
When we add the consideration of taxes – which are assessed on nominal pre-inflation earnings, not inflation-adjusted changes in purchasing power – then it is a relatively simple matter to show that the average investor in a combined 30% federal and state tax bracket, who had purchased a stock portfolio at the end of 1997 and sold at the end of 2012, would indeed, despite the surface appearance of a 50% profit, have instead lost 7% of their starting net worth – with no real profits whatsoever – once we adjust for inflation and taxes.
The appearance of a 50% profit is based on the newspaper headline approach to looking at market returns, which is the way most people look at the markets. They expect most of their money to come from changes in price levels, which are not generally adjusted for inflation.
Simply adjust for inflation and paying taxes, however, and all profits are taken, as well as a sizeable chunk of starting net worth. This is true whether taxes are paid on an ongoing basis, or as long-term capital gains, or as ordinary income when drawing down a tax-deferred retirement account.
Adjusting Total Returns For Inflation
Now while looking at price movements is a good first step, and reflects the price focus of many investors, when we move to a professional perspective we can't just stop there.
That is, the true source of most returns for stock investors over the long term has historically not been price movements, but the receipt of dividends, the reinvestment of those dividends, the reinvestment of the dividends from the reinvestments, and so forth. This is the real core of the financial mathematics behind most long term investment models, and it generates a compounding of wealth over time which is both far more profitable and substantially more stable than price movements only.
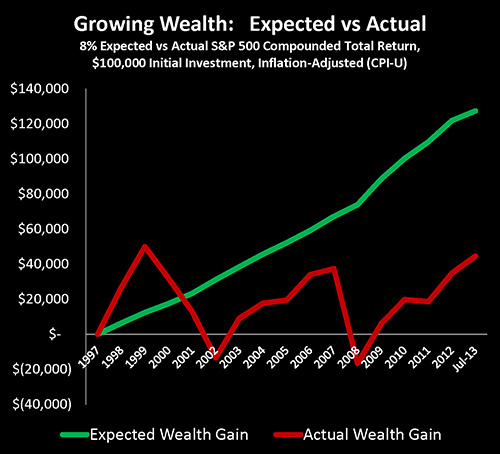
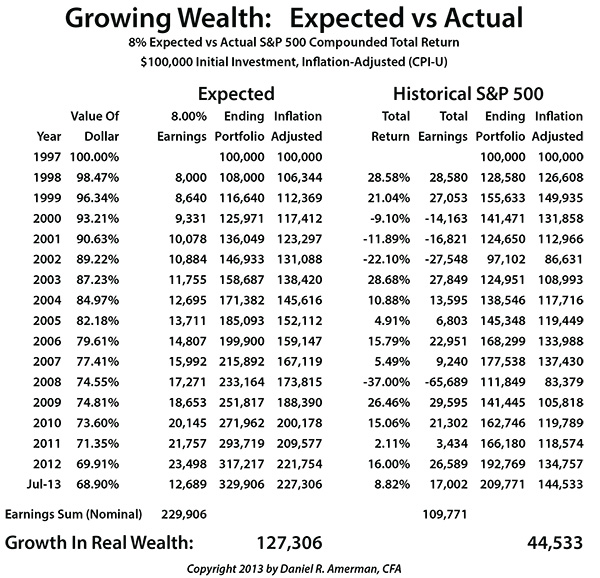
In my recent article, Creating Wealth With Stocks: Theory Versus Our New Reality, we took a look at the S&P 500 on a total return basis – including price changes, dividends and dividend reinvestments – over a 15.5 year period (which is slightly different from this article). We started with an assumed initial investment of $100,000 at the end of 1997, and looked at how much it would be worth by July of 2013.
http://danielamerman.com/articles/2013/StockWealthD.html
As demonstrated in that article, in pre-tax terms and for the nation as a whole, when we look at total return on the S&P 500 for that period between the end of 1997 and the middle of 2013, there has been about a 65% failure to perform on an inflation-adjusted basis. And as further explored in detail, if we take a common assumption of an 8% compounding rate from the late 1990s, and we examine results for the next 15 years, we find that even after fully adjusting for assumed dividends and dividend compounding – the stock market in the real world produced only about one third of the compounded wealth that most investors expected it to.
So to understand why so many pension funds have been in such trouble, and why so many investors are deferring retirement, the explanation can be found in the fact that two thirds of the assumed wealth that was built into so many financial planning models has simply failed to materialize. And this has been a particular problem for tens of millions of Boomer investors who were counting on that wealth growing in their accounts in these critical 15 years near the peak or end of their working careers, when most of their investment gains were supposed to occur.
Total Returns & Real Tax Rates
Now let's use the same methodology we did with our price-only analysis, and apply it towards understanding the dramatic impact of inflation taxes on total return.
The second half of the article is linked below. Subjects include:
A detailed explanation of the chart and graph above.
Why real tax rates on stock investments over the last 15 years have been almost twice as high as stated tax rates.
Understanding the stark contrast between the surface level of newspaper headlines, brokerage statements and tax returns, and the quite different bottom line when it comes to after-inflation and after-tax wealth creation for retirement investors and for the nation.
An alternative methodology for verification of the research presented.
How these hidden relationships have dominated real world returns for 22 out of 40 years for the two largest source of household net worth: homes and stocks.
Daniel R. Amerman, CFA
Website: http://danielamerman.com/
E-mail: mail@the-great-retirement-experiment.com
Daniel R. Amerman, Chartered Financial Analyst with MBA and BSBA degrees in finance, is a former investment banker who developed sophisticated new financial products for institutional investors (in the 1980s), and was the author of McGraw-Hill's lead reference book on mortgage derivatives in the mid-1990s. An outspoken critic of the conventional wisdom about long-term investing and retirement planning, Mr. Amerman has spent more than a decade creating a radically different set of individual investor solutions designed to prosper in an environment of economic turmoil, broken government promises, repressive government taxation and collapsing conventional retirement portfolios
© 2013 Copyright Dan Amerman - All Rights Reserved
Disclaimer: This article contains the ideas and opinions of the author. It is a conceptual exploration of financial and general economic principles. As with any financial discussion of the future, there cannot be any absolute certainty. What this article does not contain is specific investment, legal, tax or any other form of professional advice. If specific advice is needed, it should be sought from an appropriate professional. Any liability, responsibility or warranty for the results of the application of principles contained in the article, website, readings, videos, DVDs, books and related materials, either directly or indirectly, are expressly disclaimed by the author.
© 2005-2022 http://www.MarketOracle.co.uk - The Market Oracle is a FREE Daily Financial Markets Analysis & Forecasting online publication.