


Gold And Silver Price – Fundamentals Do Not Matter
Commodities / Gold and Silver 2013 Nov 02, 2013 - 12:32 PM GMTBy: Michael_Noonan

 If fundamentals mattered, gold and silver prices would be substantially higher. They
are not, and for a reason. It is not hard to define what factors are influencing price, for
they are political, even criminal under normal circumstances. These factors are, in two
words: central bankers. The money changers still have a stranglehold on the financial
system, and nowhere it is more evident than in the price of gold.
If fundamentals mattered, gold and silver prices would be substantially higher. They
are not, and for a reason. It is not hard to define what factors are influencing price, for
they are political, even criminal under normal circumstances. These factors are, in two
words: central bankers. The money changers still have a stranglehold on the financial
system, and nowhere it is more evident than in the price of gold.
Will it end? Yes, but as has been the biggest mystery, no one knows when?! While the golden grip continues, it is inexorably loosening. The United States, and by extension, the United Kingdom, is fast becoming more and more isolated. First, it was the natural opposition, Russia, China, morphing into the BRICS. Unable to sustain their no longer warranted arrogance, the Western alliances are now falling apart. Note the cover from Die Zeit, symbolic of the growing attitude of the rest of the world toward the US:
It was not enough to give the stiff arm to Germany when its representatives came to inspect its own gold, purportedly held in New York. “Nein, nein, Sie konnen nicht es sehen.” “You cannot see it, but not to worry, we will deliver half your gold in seven years,” the Germans were told, after the insulting rebuke. This is evidence of the growing in- fighting going on, and the revelation of NSA spying has driven a wedge even further.
It is paramount for Western central bankers to keep the façade of owning tonnes of gold alive, for once it gives way, all control is lost. The unilateral actions on the part of the US ensures the eventual collapse of the existing fragile unity. Of course, the core reason lies in the massive creation of digital “dollars” that are now being rejected en masse by the largest creditors holding Federal Reserve [soon to be junk] bonds. The world is finally rejecting the US exporting its destructive inflation, via the Federal Reserve “dollar.”
Continuing stories of one country or another increasing its gold imports has not been of significance, relative to the current price of gold. It may make for attention-grabbing articles, but the impact is nil. The direction for price is solely in the diminishing control of the New World Order via Basel down through the IMF and then central banks.
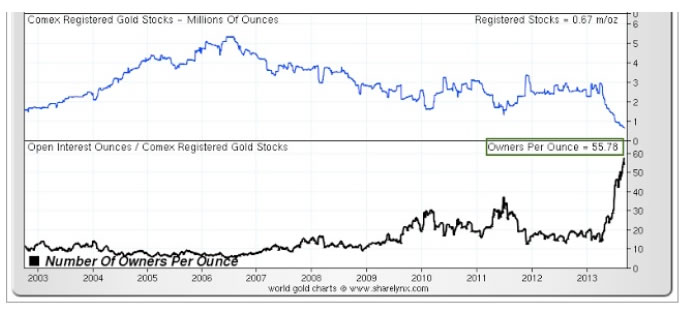
If ever a picture were worth a thousand words, it is this one of the dwindling registered gold stocks, the top graph, and the clincher graph below it showing the number of claims, almost 56 paper “owners” laying claim for each ounce of gold. This Gordian Knot cannot be resolved. It does not require much imagination to guess what will happen when 56 claims are made for each ounce.
If ever you want to see a simple graphic of supply v demand, this one encapsulates it all.
However unrealistic one may view the charts of the bogus paper pricing mechanism viewed on the COMEX, they still function as a loose barometer for the current direction of gold and silver, and by default, they will act as the weather vane until displaced by some other basis of reality.
No matter how bullishly one reads the ample news, in support of the demand for gold, it is not being translated into higher prices, as evidenced by the charts. This is why we see little value in parroting the same kinds of positive developments in the news. What is not being recognized sufficiently is the reality of the central banks maintaining control, even as it slips away, little by little.
October paints a more positive picture in the fight to rally price higher. After an attempt to decline under August and September, a rally did ensue. The negative aspect to the last bar is how sellers kept the range relatively small, proof that buyers are not able to wrest control away.
The ability to sustain the October performance is tenuous, going into November. Bulls have another month to demonstrate that the demand factors are going to translate into higher prices.
The takeaway from last week’s negative outside range bar is that buyers have a few weeks to defend the swing low, at 2, and then create a higher swing high, above 1, and change the trend to the upside. Buyers are still not meeting this burden, but points 1 and 2 are a show of effort.
D/S = Demand over Supply on the rally bar attended by the highest green volume bar since mid-August. This is the kind of bar you will see buyers defend, on a retest. Three TDs later, [Trading Days], there was another relatively strong rally bar, and the low of that bar is minor support. It also coincides with a half-way retracement of the October swing low to late October swing high.
Friday’s close was mid-range the bar, indicating balance between buys and sellers. Given that Friday was the third day of decline, it is a minor plus that buyers showed up to keep price from declining any further.
What is common to all three charts is the necessity for buyers to meet the burden of proof in shifting the trend from down to up. There is a degree of effort seen in the daily chart by virtue of a sideways trend. This is a first step in stopping a down trend that could possibly lead to an up trend. Time and price will tell.
The relatively smaller range of October, combined with a neutral close and following a decline month for September, fits into the context of the strong, wide range rally of August, making the last two months a weak retest of that rally.
Again, fundamental news is not driving price directionally for PMs. The fact that India is on track to purchase 6,000 tonnes of silver, this year, compared to just 2,000 tonnes for all of 2012, is a clear sign that overtly bullish news is not impacting the market, at least not for now. Ultimately, it will, but for now, the charts ain’t buying it.
For as long as the sideways TR, shown in the box, remains intact, holding above the TR at the lows from June/July, this has bullish connotations. That may be all well and good, for the present, but buyers need to step up their game. It is that simple.
What matters on the daily chart are the last three bars. We already know price is languishing at these lower levels. What is to happen for the near term, moving forward?
Price has been in a TR since early September. 23.50 is the upper bound, 20.50 is the lower bound. Wednesday’s rally, 3rd bar from the end, was on high volume, ostensibly bullish as price rallied into recent high ground for October. Next day, price opened much lower, erasing the positive volume, and actually making it negative, for it trapped all those who were on the buy side of that volume.
Thursday’s bar, 2nd from end, was even wider range down with a poor close and on equally high volume. Clearly, sellers took control, but in a trading range, it may not be as meaningful.
How to read Friday’s small range bar? On the one hand, what happened to the sellers’ momentum carrying price lower? It stopped, cold. On the other hand, the small range at the lower end of the bar tells us buyers were unable to rally price and extend the range higher, beyond the positive aspect of stopping the selling activity.
The mid-range close on the bar, and just about unchanged from the previous close, tells us buys and sellers were in balance. That gives a tenuous edge to buyers for showing an ability to halt the sell-off. No one knows how it will develop by Monday’s opening, but we know if buyers do not show up, sellers will have another easy time pushing price lower.
The entire discussion has been focused on paper futures. We always add that continual buying of the physical metals should be an ongoing habit. It is impossible to know when instability will take over and align price with the reality of well known demand factors. When that does occur, the availability, not just of these great prices but for the metals themselves, may disappear overnight, for some period of time.
Keep accumulating physical gold and silver, and make sure you maintain physical control, as well. Do not, under any circumstances, trust banks, and for sure, not safety deposit boxes.
By Michael Noonan
Michael Noonan, mn@edgetraderplus.com, is a Chicago-based trader with over 30 years in the business. His sole approach to analysis is derived from developing market pattern behavior, found in the form of Price, Volume, and Time, and it is generated from the best source possible, the market itself.
© 2013 Copyright Michael Noonan - All Rights Reserved Disclaimer: The above is a matter of opinion provided for general information purposes only and is not intended as investment advice. Information and analysis above are derived from sources and utilising methods believed to be reliable, but we cannot accept responsibility for any losses you may incur as a result of this analysis. Individuals should consult with their personal financial advisors.
Michael Noonan Archive |
© 2005-2022 http://www.MarketOracle.co.uk - The Market Oracle is a FREE Daily Financial Markets Analysis & Forecasting online publication.